
Page 206 - IJB-10-6
P. 206
International Journal of Bioprinting Effect of G/GO on photocurable resin structure
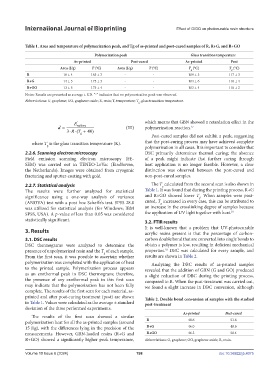
Table 1. Area and temperature of polymerization peak, and Tg of as-printed and post-cured samples of R, R+G, and R+GO
Polymerization peak Glass transition temperature
As-printed Post-cured As-printed Post
Area (J/g) T (°C) Area (J/g) T (°C) T (°C) T (°C)
g g
R 16 ± 4 165 ± 3 - - 109 ± 3 117 ± 3
R+G 14 ± 3 175 ± 3 - - 104 ± 6 110 ± 4
R+GO 13 ± 5 173 ± 4 - - 103 ± 4 110 ± 2
Notes: Results are presented as average ± S.D. “-” indicates that no polymerization peak was observed.
Abbreviations: G, graphene; GO, graphene oxide; R, resin; T, temperature; T , glass transition temperature.
g
E ' which means that GBN showed a retardation effect in the
d = rubbery (III) polymerization reaction. 27
RT + 40
3 ⋅⋅( g )
Post-cured samples did not exhibit a peak, suggesting
where T is the glass transition temperature (K). that the post-curing process may have achieved complete
g polymerization in all cases. It is important to consider that
2.2.6. Scanning electron microscopy DSC primarily determines thermal curing; the absence
Field emission scanning electron microscopy (FE- of a peak might indicate that further curing through
SEM) was carried out in TENEO-LoVac (Eindhoven, heat application is no longer feasible. However, a clear
the Netherlands). Images were obtained from cryogenic distinction was observed between the post-cured and
fracturing and sputter-coating with gold. non-post-cured samples.
2.2.7. Statistical analysis The T calculated from the second scan is also shown in
g
The results were further analyzed for statistical Table 1. It was found that during the printing process, R+G
significance using a one-way analysis of variance and R+GO showed lower T . When samples were post-
g
(ANOVA) test with a post hoc Scheffe’s test. SPSS 28.0 cured, T increased in every case, this can be attributed to
g
was utilized for statistical analysis (for Windows; IBM an increase in the crosslinking degree of samples because
SPSS, USA). A p-value of less than 0.05 was considered the application of UV light together with heat. 18
statistically significant. 3.2. FTIR results
It is well-known that a problem that UV-photocurable
3. Results acrylic resins present is that the percentage of carbon-
3.1. DSC results carbon double bond that are converted into single bonds to
DSC thermograms were analyzed to determine the obtain a polymer is low, resulting in deficient mechanical
28
presence of unpolymerized resin and the T of each sample. properties. DBC was calculated for every sample, and
g
From the first scan, it was possible to ascertain whether results are shown in Table 2.
polymerization was completed with the application of heat Analyzing the DBC results of as-printed samples
to the printed sample. Polymerization process appears revealed that the addition of GBN (G and GO) produced
as an exothermal peak in DSC thermogram; therefore, a slight reduction of DBC during the printing process,
the presence of any exothermal peak in this first scan compared to R. When the post-treatment was carried out,
may indicate that the polymerization has not been fully we found a slight increase in DBC conversion, although
complete. The results of the first scan for each material, as-
printed and after post-curing treatment (post) are shown Table 2. Double bond conversion of samples with the studied
in Table 1. Values were calculated as the average ± standard post-treatment
deviation of the three performed experiments.
As-printed Post-cured
The results of the first scan showed a similar
polymerization heat for all the as-printed samples (around R 48.6 51.6
15 J/g), with the differences lying in the precision of the R+G 46.0 48.6
measurements. However, GBN-loaded resins (R+G and R+GO 46.3 50.4
R+GO) showed a significantly higher peak temperature, Abbreviations: G, graphene; GO, graphene oxide; R, resin.
Volume 10 Issue 6 (2024) 198 doi: 10.36922/ijb.4075