
Page 207 - IJB-10-6
P. 207
International Journal of Bioprinting Effect of G/GO on photocurable resin structure
this increase was less notable for G resin. In all cases, the this reduction being particularly notable in the case of G.
degree of conversion was around 50% with similar values The reduction was about 18% in the case of R+GO and
reported in other studies. The residual unreacted double 38% in R+G. This decrease in mechanical properties was
29
bonds could exist either as free unreacted monomer or as accompanied by a decrease in Young’s modulus, which also
pendant groups within the polymer network. was more pronounced for R+G. Regarding the elongation
at break, a slight increase was observed only in the R+GO.
3.3. Tensile tests results
Besides tensile strength, tensile tests also provided In all cases, post-curing enhanced the tensile
information about the stiffness of samples and its elasticity strength and rigidity of the samples while reducing their
through Young’s modulus and elongation at break. The elongation at break compared to the as-printed samples.
three parameters obtained are shown in Table 3, and a This improvement may be attributable to increased
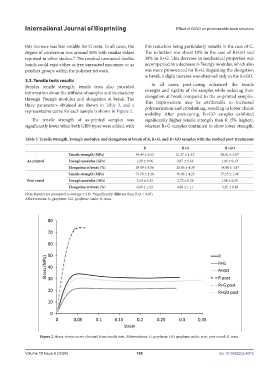
representative curve for each sample is shown in Figure 2. polymerization and crosslinking, resulting in lower chains
mobility. After post-curing, R+GO samples exhibited
The tensile strength of as-printed samples was significantly higher tensile strength than R (5% higher),
significantly lower when both GBN types were added, with whereas R+G samples continued to show lower strength.
Table 3. Tensile strength, Young’s modulus, and elongation at break of R, R+G, and R+GO samples with the studied post-treatments
R R+G R+GO
Tensile strength (MPa) 34.49 ± 0.52 21.27 ± 1.52 * 28.41 ± 3.87 *
As-printed Young’s modulus (GPa) 1.29 ± 0.06 0.87 ± 0.34 * 1.06 ± 0.13 *
Elongation at break (%) 29.49 ± 8.56 28.66 ± 4.39 34.80 ± 3.87
Tensile strength (MPa) 73.79 ± 1.28 70.06 ± 4.23 77.55 ± 1.06 *
Post-cured Young’s modulus (GPa) 2.50 ± 0.13 2.72 ± 0.28 1.88 ± 0.39 *
Elongation at break (%) 6.68 ± 1.52 4.80 ± 1.11 * 5.25 ± 0.49
Note: Results are presented as average ± S.D. *Significantly different than R (p < 0.05).
Abbreviations: G, graphene; GO, graphene oxide; R, resin.
Figure 2. Stress–strain curves obtained from tensile tests. Abbreviations: G, graphene; GO, graphene oxide; post, post-cured; R, resin.
Volume 10 Issue 6 (2024) 199 doi: 10.36922/ijb.4075