
Page 210 - IJB-10-6
P. 210
International Journal of Bioprinting Effect of G/GO on photocurable resin structure
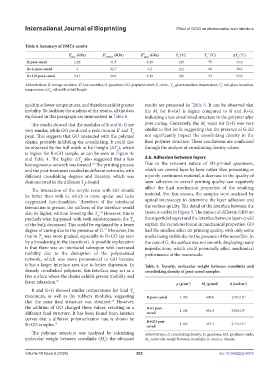
Table 4. Summary of DMTA results
E’ glass (GPa) E’ rubbery (MPa) E’’ glass (GPa) T (°C) T ’ (°C) ΔT (°C)
α
α
α
R post-cured 2.26 31.5 0.19 115 75 33.9
R+G post-cured 2 32.7 0.2 112 68 38.0
R+GO post-cured 1.47 28.6 0.19 106 53 52.9
Abbreviations: E’, storage modulus; E’’, loss modulus; G, graphene; GO, graphene oxide; R, resin.; T , glass transition temperature; T ’, sub-glass transition
α
α
temperature; ΔT , ull width at half height
α
quickly, at lower temperatures, and therefore exhibit greater results are presented in Table 5. It can be observed that
mobility. To facilitate the analysis of the results, all the data the M for R+GO is higher compared to R and R+G,
c
explained in this paragraph are summarized in Table 4. indicating a less crosslinked structure in the polymer after
The results showed that the modulus of R and R+G are post-curing. Conversely, the M value for R+G was very
c
very similar, while GO produced a reduction in E’ and T similar to that for R, suggesting that the presence of G did
α
peak. This suggests that GO interacted with the polymer not significantly impact the crosslinking density in the
chains, probably inhibiting the crosslinking. It could also final polymer structure. These conclusions are confirmed
be observed by the full width at half height (ΔT ), which through the analysis of crosslinking density values.
α
is higher for R+GO sample, as can be seen in Figure 4c
and Table 4. The higher ΔT also suggested that a less 3.6. Adhesion between layers
α
homogeneous network was formed. The printing process Due to the inherent nature of 3D-printed specimens,
18
and the post-treatment resulted in different networks, with which are created layer by layer rather than presenting as
different crosslinking degrees and linearity, which was a purely continuous material, a decrease in the quality of
demonstrated in the different T s found. layer adhesion or overall printing quality can negatively
g
The interaction of the acrylic resin with GO should affect the final mechanical properties of the resulting
be better than with G, which is more apolar and lacks material. For this reason, the samples were analyzed by
oxygenated functionalities. Therefore, if the interfacial optical microscopy to determine the layer adhesion and
interaction is greater, the stiffness of the interface would the surface quality. The detail of the interface between the
also be higher, without lowering the T . However, this is layers is visible in Figure 5. The impact of different GBN on
34
α
precisely what happened: with both reinforcements, the T the superficial aspect and the interface between layers could
α
of the bulk decreased. This could be explained by a lower explain the variations found in mechanical properties. GO
degree of curing due to the presence of G. Moreover, the had the smallest effect on printing quality, with only some
17
rise in T was more gradual, especially in R+GO (as seen marks being visible due to the presence of the nanofiller. In
α
by a broadening in the transition). A possible explanation the case of G, the surface was not smooth, displaying many
is that there was an interfacial subregion with increased imperfections, which could potentially affect mechanical
mobility due to the disruption of the polymerized performance at the macroscale.
network, which was more pronounced in GO because
it has a larger interface area due to better dispersion. In Table 5. Density, molecular weight between crosslinks and
densely crosslinked polymers, this interface may act as a crosslinking density of post-cured samples
free surface where the chains exhibit greater mobility and
faster relaxation. 35 ρ (g/cm ) M (g/mol) d (mol/m )
3
3
c
R and R+G showed similar temperatures for final T
α
maximum, as well as the rubbery modulus, suggesting R post-cured 1.185 400.0 2.95×10 -3
that the same final structure was obtained. However,
36
the addition of GO changed these values, resulting in a R+G post- -3
different final structure. It has been found from kinetics cured 1.181 401.4 3.08×10
curves that a different polymerization rate is shown by R+GO post-
R+GO samples. 17 cured 1.182 437.3 2.74×10 -3
The polymer structure was analyzed by calculating Abbreviations: d, crosslinking density; G, graphene; GO, graphene oxide;
molecular weight between crosslinks (M ); the obtained M , molecular weight between crosslinks; R, resin; ρ, density.
c
c
Volume 10 Issue 6 (2024) 202 doi: 10.36922/ijb.4075