
Page 208 - IJB-10-6
P. 208
International Journal of Bioprinting Effect of G/GO on photocurable resin structure
Interestingly, R+GO still showed a lower Young’s modulus (shown with red arrows), which indicated a reasonably
compared to R and R+G. uniform dispersion of GO and a ductile fracture. Surface
undulations often signal an increased fracture toughness,
Considering that as-printed R+G and R+GO samples
showed similar DBC values, the observed differences primarily because they absorb more fracture energy,
thereby improving the matrix capacity to withstand
in mechanical properties do not seem proportional to damage. 31,32 This more ductile behavior observed in the
the DBC reduction. This suggests that the differences fracture of R+GO samples should be reflected in the
are not solely due to low polymerization caused by GBN mechanical properties, while post-curing enhanced tensile
presence. This deduction is further supported by the post- strength in R+GO, the transition from the brittle fracture of
cured mechanical results, where the lack of correlation R to the more ductile nature of R+GO is more pronounced
between DBC and mechanical properties persists. While than the observed increase in tensile strength values. This
post-curing does enhance mechanical properties, this significant observation will be further discussed in the
improvement may originate not only from increased Section 4.
polymerization but also from enhanced crosslinking
within the polymeric matrix. 3.5. DMTA results
Furthermore, the reduction in Young’s modulus The DMTA tests were exclusively conducted on post-cured
for both, as-printed and post-cured samples, aligns samples, as the as-printed specimens exhibited a sticky
consistency that could damage the testing equipment.
with the observed decrease in T upon GBN addition. Furthermore, the focus on post-cured samples aligns with
g
This correlation suggests that variations in mechanical their relevance to the final application, with as-printed
properties are related to the crosslinking and changes in samples being studied just for comparative purposes to
molecular structure of each composite. understand the impact of post-curing on the properties
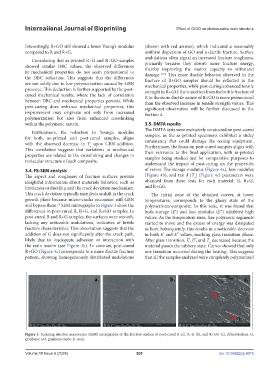
3.4. FE-SEM analysis of resins. The storage modulus (Figure 4a), loss modulus
The aspect and roughness of fracture surfaces provide (Figure 4b), and tan δ (T ) (Figure 4c) parameters were
α
insightful information about materials behavior, such as obtained from these tests for each material: R, R+G,
brittleness or ductility, and the crack deviation mechanism. and R+GO.
This crack deviation typically manifests as shift in the crack The initial zone of the obtained curves, at lower
growth plane because micro-cracks encounter stiff GBN temperatures, corresponds to the glassy state of the
30
and bypass them. SEM micrographs in Figure 3 show the polymer/nanocomposite. In this zone, it was found that
differences in post-cured R, R+G, and R+GO samples. In both storage (E’) and loss modulus (E’’) exhibited high
post-cured R and R+G samples, the surfaces were smooth, values. As the temperature rises, free polymeric segments
lacking any noticeable undulations, indicative of brittle started to move and the excess of energy was dissipated
fracture characteristics. This observation suggests that the as heat. Subsequently, this results in a noticeable decrease
addition of G does not significantly alter the crack path, in both E’ and E’’ values, marking glass transition phase.
likely due to inadequate adhesion or interaction with After glass transition, E’, E’’, and T decreased because the
α
the resin matrix (see Figure 3b). In contrast, post-cured material passes the rubbery state. Curves showed that only
R+GO (Figure 3c) corresponds to a more ductile fracture one transition occurred during the heating. This suggests
pattern, showing homogeneously distributed undulations that all the samples analyzed were completely polymerized
Figure 3. Scanning electron microscope (SEM) micrographs of the fracture surface of post-cured R (a), R+G (b), and R+GO (c). Abbreviations: G,
graphene; GO, graphene oxide; R, resin.
Volume 10 Issue 6 (2024) 200 doi: 10.36922/ijb.4075