
Page 225 - IJB-10-6
P. 225
International Journal of Bioprinting 3DP Ta buttress in DDH shelf acetabuloplasty
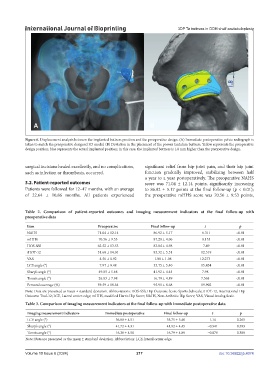
Figure 6. Displacement analysis between the implanted buttress position and the preoperative design. (A) Immediate postoperative pelvic radiograph is
taken to match the preoperative designed 3D model. (B) Deviation in the placement of the porous tantalum buttress. Yellow represents the preoperative
design position; blue represents the actual implanted position; in this case, the implanted buttress is 1.8 mm higher than the preoperative design.
surgical incisions healed excellently, and no complications, significant relief from hip joint pain, and their hip joint
such as infection or thrombosis, occurred. function gradually improved, stabilizing between half
a year to a year postoperatively. The preoperative NAHS
3.2. Patient-reported outcomes score was 71.04 ± 12.14 points, significantly increasing
Patients were followed for 12–47 months, with an average to 86.92 ± 5.17 points at the final follow-up (p < 0.01);
of 22.64 ± 10.86 months. All patients experienced the preoperative mHHS score was 70.56 ± 9.53 points,
Table 2. Comparison of patient-reported outcomes and imaging measurement indicators at the final follow-up with
preoperative data
Item Preoperative Final follow-up t p
NAHS 71.04 ± 12.14 86.92 ± 5.17 −6.311 <0.01
mHHS 70.56 ± 9.53 87.20 ± 4.06 −8.133 <0.01
HOS-SSS 62.52 ± 13.53 83.84 ± 4.98 −7.49 <0.01
iHOT-12 51.60 ± 14.01 85.32 ± 5.51 −12.519 <0.01
VAS 4.56 ± 0.92 1.08 ± 1.08 12.273 <0.01
LCE angle (°) 7.97 ± 9.48 35.75 ± 5.40 −15.454 <0.01
Sharp’s angle (°) 49.85 ± 5.68 41.92 ± 4.45 7.98 <0.01
Tonnis angle (°) 26.83 ± 7.98 16.79 ± 4.89 7.568 <0.01
Femoral coverage (%) 59.59 ± 10.64 95.95 ± 8.68 −19.902 <0.01
Note: Data are presented as mean ± standard deviation. Abbreviations: HOS-SSS, Hip Outcome Score-Sports Subscale; iHOT-12, International Hip
Outcome Tool-12; LCE, Lateral center-edge; mHHS, modified Harris Hip Score; NAHS, Non-Arthritic Hip Score; VAS, Visual Analog Scale.
Table 3. Comparison of imaging measurement indicators at the final follow-up with immediate postoperative data
Imaging measurement indicators Immediate postoperative Final follow-up t p
LCE angle (°) 36.80 ± 4.51 35.75 ± 5.40 1.14 0.265
Sharp’s angle (°) 41.72 ± 4.31 41.92 ± 4.45 −0.541 0.593
Tonnis angle (°) 16.28 ± 4.50 16.79 ± 4.89 −0.879 0.388
Note: Data are presented as the mean ± standard deviation. Abbreviation: LCE, lateral center edge.
Volume 10 Issue 6 (2024) 217 doi: 10.36922/ijb.4074