
Page 272 - IJB-10-6
P. 272
International Journal of Bioprinting Skin bioprinting: Keratinocytes and stem cells
Table 2. Composition of hydrogels the bioprinted constructs were measured using a DHR-3
rheometer (TA Instruments, USA), equipped with a 20-
Hydrogel Biomaterial(s) mm plate-plate geometry for the hydrogels and an 8-mm
I Alginate (0.5% [m/v]) and gelatin (0.5% [m/v]) plate-plate geometry for the biofabricated constructs,
II Fibrin (1.1% [m/v]) and set to oscillating compression mode. The tests were
Fibrinogen (1.8% [m/v]), alginate (1% [m/v]), and performed at a constant rheometer temperature of 37°C.
III
hyaluronic acid (1% [m/v]) The storage modulus (E’) and loss modulus (E”) were
Alginate (0.5% [m/v]), gelatin (0.5% [m/v]), determined by increasing the frequency from 0.3 to 100
IV collagen (0.05% [m/v]), and hyaluronic acid (3% rad/s. The complex modulus was calculated using the
[m/v]) following equation:
Alginate (0.5% [m/v]), gelatin (3% [m/v]), and
V
hyaluronic acid (0.1% [m/v]) E = E +’ 2 E" 2 (I)
∗
Gelatin methacryloyl (4% [m/v]) and lithium
VI phenyl-2,4,6-trimethyl benzoyl phosphinate (LAP) The mean and standard deviation of the samples were
(0.2% [m/v])
calculated for samples that fulfill the following criteria:
(i) storage modulus and loss modulus were positive and
3
min at −85°C under high vacuum (<1 × 10 mbar) in a recorded by the rheometer; (ii) no drastic alteration of
Sputter Coater machine (ACE 400; Leica Microsystems, the axial force was recorded during the measurement;
Germany). The samples were then sputtered with 3 (iii) the oscillation force was significantly higher than the
nm platinum and transferred to the scanning electron predetermined lower limit given by the manufacturer; and
microscope (SEM) chamber (Crossbeam 340; Zeiss, (iv) raw data signals for recorded force and displacement
Germany). Images of the hydrogel surface morphology resulted in a sinusoidal curve. The values are based on at
were taken at −160°C using an acceleration voltage of 8 kV. least three technical replicates, except for GelMA (at 75.4
and 100 rad/s) in phase 1, where only two replicates met
2.3.3. Stiffness analysis the above criteria.
The stiffness of the cast hydrogels of the second phase of
the study was analyzed for groups I–VI. Here, samples were 2.3.4. Diffusion assay
measured on day 1 after overnight incubation in HBSS at To ensure that proteins expressed by encapsulated cells can
37°C. The stiffness of the biofabricated constructs of the diffuse through the hydrogels, we used HEK293 reporter
third phase was analyzed for groups Ib (Alg/HA/Gel and cells, which have been reported to consistently express a
Alg/HA/Fib with HaCaT and ADSCs) and IIb (GelMA fusion protein consisting of the extracellular domain of
and Alg/HA/Fib with HaCaT and ADSCs), as well as for TNFR2, the human IgG1 Fc domain, and Gaussia princeps
comparative constructs without cells (Alg/HA/Gel and luciferase (GpL). The reporter cells were mixed with the
Alg/HA/Fib; GelMA and Alg/HA/Fib). The samples were hydrogels (Table 2) at a concentration of 1 × 10 cells/mL.
6
cultured in cell culture media. Viscoelastic properties of A total of 100 µL of each hydrogel was cast into the wells of
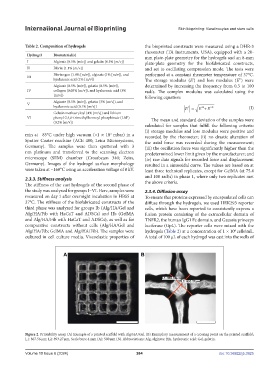
Figure 2. Printability assay. (A) Example of a printed scaffold with Alg/HA/Gel. (B) Exemplary measurement of a crossing point on the printed scaffold;
L1: 867.56 µm; L2: 893.27 µm. Scale bars: 4 mm (A); 500 μm (B). Abbreviations: Alg, alginate; HA, hyaluronic acid; Gel, gelatin.
Volume 10 Issue 6 (2024) 264 doi: 10.36922/ijb.3925