
Page 557 - IJB-10-6
P. 557
International Journal of Bioprinting Internally-crosslinked ADA/Alg/Gel bioinks
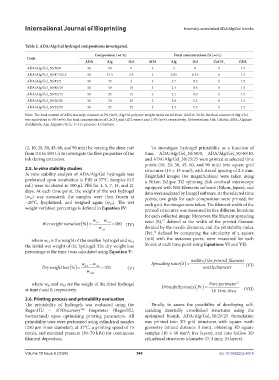
Table 2. ADA/Alg/Gel hydrogel compositions investigated.
Composition (wt.%) Final concentrations (% [w/v])
Code
ADA Alg Gel ADA Alg Gel CaCO GDL
3
ADA/Alg/Gel_50/50/0 50 50 0 3 3 0 6 1.5
ADA/Alg/Gel_50/47.5/2.5 50 47.5 2.5 3 2.85 0.15 6 1.5
ADA/Alg/Gel_50/45/5 50 45 5 3 2.7 0.3 6 1.5
ADA/Alg/Gel_50/40/10 50 40 10 3 2.4 0.6 6 1.5
ADA/Alg/Gel_50/35/15 50 35 15 3 2.1 0.9 6 1.5
ADA/Alg/Gel_50/30/20 50 30 20 3 1.8 1.2 6 1.5
ADA/Alg/Gel_50/25/25 50 25 25 3 1.5 1.5 6 1.5
Note: The final content of ADA was kept constant at 3% (w/v); Alg:Gel polymer weight ratios varied from 100:0 to 50:50; the final content of Alg+Gel
was equivalent to 3% (w/v); the final concentrations of CaCO and GDL were 6 and 1.5% (w/v), respectively. Abbreviations: Gel: Gelatin; ADA: Alginate
3
dialdehyde; Alg: Alginate; GDL: D-(+)-glucono-1,5-lactone.
(2, 10, 20, 30, 45, 60, and 90 min) by varying the shear rate To investigate hydrogel printability as a function of
from 0.1 to 500 1/s to investigate the flow properties of the time, ADA/Alg/Gel_50/50/0, ADA/Alg/Gel_50/40/10,
ink during extrusion. and ADA/Alg/Gel_50/25/25 were printed at selected time
points (10, 20, 30, 45, 60, and 90 min) into square grid
2.5. In vitro stability studies structures (15 × 15 mm ), with strand spacing of 2.5 mm.
2
In vitro stability analysis of ADA/Alg/Gel hydrogels was Brightfield images (4× magnification) were taken using
performed upon incubation in PBS at 37°C. Samples (0.5 a Nikon Eclipse Ti2 spinning disk confocal microscope
mL) were incubated in 500 µL PBS for 1, 5, 7, 14, and 21 equipped with NIS-Elements software (Nikon, Japan), and
days. At each time point, the weight of the wet hydrogel data were analyzed by ImageJ software. At the selected time
(w s,t) was measured; the samples were then frozen at points, two grids for each composition were printed; for
−20°C, lyophilized, and weighed again (w d,t). The wet each grid, five images were taken. The filament width of the
weight variation percentage is defined in Equation IV: printed structures was measured in five different locations
for each collected image. Moreover, the filament spreading
w − w ratio (S), defined as the width of the printed filament
47
Wetweightvariation() = st s,0 ×100 (IV)
w s,0 divided by the needle diameter, and the printability index
(Pr), defined by comparing the circularity of a square
48
where w s,t is the weight of the swollen hydrogel and w s,0 (π/4) with the outcome pores, were measured for each
the initial wet weight of the hydrogel. The dry weight loss bioink at each time point using Equations VI and VII:
percentage at the time i was calculated using Equation V:
widthofthe printedfilament
w − w Spreadingratio S (VI)
Dryweightloss()= d,0 d t, ×100 (V) nozzlediaameter
w d,0
where w d,t and w d,0 are the weight of the dried hydrogel Pore perimeter 2
at time t and 0, respectively. PrintabilityindexPr ( ) = 16 Pore Area (VII)
2.6. Printing process and printability evaluation
The printability of hydrogels was evaluated using the Finally, to assess the possibility of developing self-
RegenHU – 3DDiscovery bioprinter (RegenHU, standing internally crosslinked structures using the
TM
Switzerland) upon optimizing printing parameters. All optimized bioink, ADA/Alg/Gel_50/25/25 formulation
printability tests were performed using cylindrical nozzles was printed into 3D grid structures with square mesh
(250 μm inner diameter), at 37°C, a printing speed of 15 geometry (strand distance: 5 mm), obtaining 3D square
mm/s, and minimal pressure (30–70 kPa) for continuous samples (10 × 10 mm ; five layers), and into hollow 3D
2
filament deposition. cylindrical structures (diameter ∅: 3 mm; 10 layers).
Volume 10 Issue 6 (2024) 549 doi: 10.36922/ijb.4014