
Page 559 - IJB-10-6
P. 559
International Journal of Bioprinting Internally-crosslinked ADA/Alg/Gel bioinks
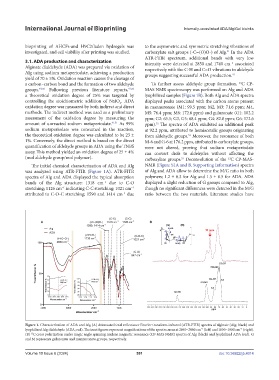
bioprinting of AHCFs-and H9C2/laden hydrogels was to the asymmetric and symmetric stretching vibrations of
investigated, and cell viability after printing was studied. carboxylate salt groups (-C=(O)O-) of Alg. In the ADA
41
ATR-FTIR spectrum, additional bands with very low
3.1. ADA production and characterization intensity were detected at 2850 and 1740 cm associated
−1
Alginate dialdehyde (ADA) was prepared via oxidation of respectively with the C-H and C=O vibrations in aldehyde
Alg using sodium metaperiodate, achieving a production groups suggesting successful ADA production. 41
yield of 70 ± 5%. Oxidation reaction causes the cleavage of
a carbon–carbon bond and the formation of two aldehyde To further assess aldehyde group formation, C CP-
13
groups. 49,50 Following previous literature reports, 41,50 MAS NMR spectroscopy was performed on Alg and ADA
a theoretical oxidation degree of 25% was targeted by lyophilized samples (Figure 1B). Both Alg and ADA spectra
controlling the stoichiometric addition of NaIO . ADA displayed peaks associated with the carbon atoms present
4
oxidation degree was measured by both indirect and direct in mannuronate (M1: 99.5 ppm; M2, M3: 71.6 ppm; M4,
methods. The indirect method was used as a preliminary M5: 76.4 ppm; M6: 172.6 ppm) and guluronate (G1: 102.2
assessment of the oxidation degree by measuring the ppm; G2: 65.5; G3, G5: 68.4 ppm; G4: 82.8 ppm; G6: 172.6
amount of unreacted sodium metaperiodate. 41,51 As 99% ppm). The spectra of ADA exhibited an additional peak
52
sodium metaperiodate was consumed in the reaction, at 92.2 ppm, attributed to hemiacetalic groups originating
the theoretical oxidation degree was calculated to be 23 ± from aldehydic groups. Moreover, the resonance of both
53
1%. Conversely, the direct method is based on the direct M-6 and G-6 at 176.2 ppm, attributed to carboxylate groups,
quantification of aldehyde groups in ADA using the TNBS were not altered, proving that sodium metaperiodate
assay. This method yielded an oxidation degree of 25 ± 4% can convert diols to aldehydes without affecting the
(mol aldehyde group/mol polymer). carboxylate groups. Deconvolution of the C CP-MAS-
53
13
The initial chemical characterization of ADA and Alg NMR (Figure S1A and B, Supporting Information) spectra
was analyzed using ATR-FTIR (Figure 1A). ATR-FITR of Alg and ADA allow to determine the M/G ratio in both
spectra of Alg and ADA displayed the typical absorption polymers; 1.2 ± 0.3 for Alg and 1.5 ± 0.5 for ADA. ADA
−1
bands of the Alg structure: 1318 cm due to C-O displayed a slight reduction of G groups compared to Alg,
stretching; 1126 cm indicating C-C stretching; 1021 cm though no significant differences were detected in the M/G
−1
−1
attributed to C-O-C stretching; 1590 and 1414 cm due ratio between the two materials. Literature studies have
−1
Figure 1. Characterization of ADA and Alg (A) Attenuated total reflectance Fourier transform infrared (ATR-FTIR) spectra of alginate (Alg; black) and
lyophilized Alg dialdehyde (ADA; red). The inset figures represent magnifications of the spectra areas at 2840–2860 cm (left) and 1650–1800 cm (right).
−1
−1
(B) C cross polarization under magic angle spinning nuclear magnetic resonance (CP-MAS NMR) spectra of Alg (black) and lyophilized ADA (red). G
13
and M represents guluronate and mannuronate groups, respectively.
Volume 10 Issue 6 (2024) 551 doi: 10.36922/ijb.4014