
Page 50 - IJB-7-2
P. 50
Investigating the Influence of Architecture and Material Composition of 3D Printed Anatomical Design Scaffolds for Large Bone Defects
A A B
C D
B
E F
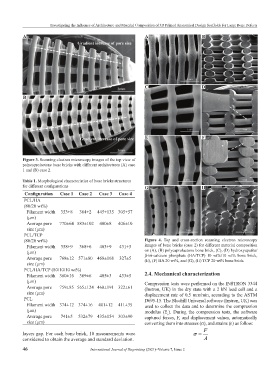
Figure 3. Scanning electron microscopy images of the top view of
polycaprolactone bone bricks with different architectures (A) case
1 and (Β) case 2.
Table 1. Morphological characteristics of bone bricks structures
for different configurations G H
Configuration Case 1 Case 2 Case 3 Case 4
PCL/HA
(80/20 wt%)
Filament width 353±8 364±2 445±135 305±57
(μm)
Average pore 770±64 583±102 400±8 406±10
size (μm)
PCL/TCP
(80/20 wt%) Figure 4. Top and cross-section scanning electron microscopy
Filament width 358±9 368±6 403±9 431±5 images of bone bricks (case 2) for different material composition
(μm) on (A), (B) polycaprolactone bone brick, (C), (D) hydroxyapatite/
Average pore 768±12 571±80 468±168 327±5 β-tri-calcium phosphate (HA/TCP) 10 wt%/10 wt% bone brick,
(E), (F) HA 20 wt%, and (G), (H) TCP 20 wt% bone brick.
size (μm)
PCL/HA/TCP (80/10/10 wt%)
Filament width 360±16 369±6 405±3 433±5 2.4. Mechanical characterization
(μm) Compression tests were performed on the INSTRON 3344
Average pore 759±85 565±124 460±191 322±61 (Instron, UK) in the dry state with a 2 kN load cell and a
size (μm) displacement rate of 0.5 mm/min, according to the ASTM
PCL D695-15. The Bluehill Universal software (Instron, UK) was
Filament width 374±12 374±16 401±12 411±35 used to collect the data and to determine the compression
(μm) modulus (E ). During the compression tests, the software
c
Average pore 741±5 532±79 435±154 303±90 captured forces, F, and displacement values, automatically
size (μm) converting them into stresses (σ), and strains (ε) as follow:
F
layers gap. For each bone brick, 10 measurements were =
considered to obtain the average and standard deviation. A
46 International Journal of Bioprinting (2021)–Volume 7, Issue 2