
Page 52 - IJB-7-2
P. 52
Investigating the Influence of Architecture and Material Composition of 3D Printed Anatomical Design Scaffolds for Large Bone Defects
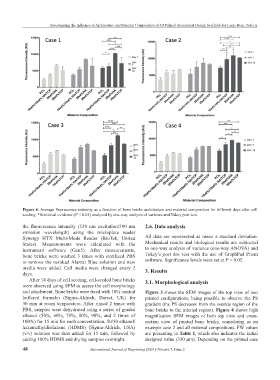
Figure 6. Average fluorescence intensity as a function of bone bricks architecture and material composition for different days after cell
seeding. *Statistical evidence (P < 0.05) analyzed by one-way analysis of variance and Tukey post-test.
the fluorescence intensity (530 nm excitation/590 nm 2.6. Data analysis
emission wavelength) using the microplate reader
Synergy HTX Multi-Mode Reader (BioTek, United All data are represented as mean ± standard deviation.
States). Measurements were calculated with the Mechanical results and biological results are subjected
instrument software (Gen5). After measurements, to one-way analysis of variance (one-way ANOVA) and
bone bricks were washed 3 times with sterilized PBS Tukey’s post hoc test with the use of GraphPad Prism
to remove the residual Alamar Blue solution and new software. Significance levels were set at P < 0.05.
media were added. Cell media were changed every 2 3. Results
days.
After 14 days of cell seeding, cell-seeded bone bricks 3.1. Morphological analysis
were observed using SEM to assess the cell morphology
and attachment. Bone bricks were fixed with 10% neutral Figure 3 shows the SEM images of the top view of two
buffered formalin (Sigma-Aldrich, Dorset, UK) for printed configurations, being possible to observe the PS
30 min at room temperature. After rinsed 2 times with gradient (the PS decreases from the outside region of the
PBS, samples were dehydrated using a series of graded bone bricks to the internal region). Figure 4 shows high
ethanol (50%, 60%, 70%, 80%, 90%, and 2 times of magnification SEM images of both top view and cross-
100%) for 15 min for each concentration. 50/50 ethanol/ section view of printed bone bricks, considering as an
hexamethyldisilazane (HDMS) (Sigma-Aldrich, USA) example case 2 and all material compositions. FW values
(v/v) solution was then added for 15 min, followed by are presenting in Table 1, which also indicates the initial
adding 100% HDMS and drying samples overnight. designed value (330 μm). Depending on the printed case
48 International Journal of Bioprinting (2021)–Volume 7, Issue 2