Page 133 - IJB-7-4
P. 133

Li, et al
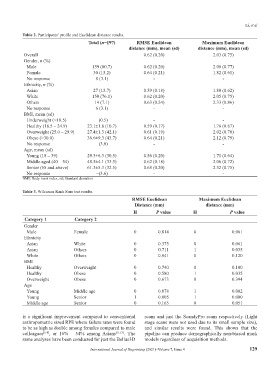
           Table 2. Participants’ profile and Euclidean distance results.
                                       Total (n=197)       RMSE Euclidean              Maximum Euclidean
                                                        distance (mm), mean (sd)     distance (mm), mean (sd)
           Overall                                            0.62 (0.20)                   2.03 (0.75)
           Gender, n (%)
            Male                        159 (80.7)            0.62 (0.20)                   2.08 (0.77)
            Female                       30 (15.2)            0.64 (0.21)                   1.82 (0.61)
            No response                   8 (3.1)                 -                             -
           Ethnicity, n (%)
            Asian                        27 (13.7)            0.59 (0.18)                   1.80 (0.62)
            White                       150 (76.1)            0.62 (0.20)                   2.05 (0.75)
            Others                       14 (7.1)             0.63 (0.24)                   2.33 (0.86)
            No response                   6 (3.1)                 -                             -
           BMI, mean (sd)
            Underweight (<18.5)           −(0.5)                  -                             -
            Healthy (18.5 – 24.9)     23.1±1.8 (10.7)         0.59 (0.17)                   1.76 (0.67)
            Overweight (25.0 – 29.9)  27.4±1.3 (42.1)         0.61 (0.19)                   2.02 (0.70)
            Obese (>30.0)             36.6±9.3 (43.7)         0.64 (0.21)                   2.12 (0.79)
            No response                   −(3.0)                  -                             -
           Age, mean (sd)
            Young (18 – 39)           29.3±6.3 (30.5)         0.56 (0.20)                   1.71 (0.64)
            Middle aged (40 – 54)     48.5±4.1 (33.5)         0.62 (0.18)                   2.06 (0.72)
            Senior (55 and above)     61.3±5.3 (32.5)         0.68 (0.20)                   2.32 (0.75)
            No response                   −(3.6)                  -                             -
           BMI; Body mass index, sd; Standard deviation

           Table 3. Wilcoxon Rank Sum test results.
                                                         RMSE Euclidean               Maximum Euclidean
                                                          Distance (mm)                  distance (mm)
                                                          H        P value         H               P value
           Category 1            Category 2
           Gender
            Male                Female                    0         0.814           0               0.061
           Ethnicity
            Asian               White                     0         0.375           0               0.061
            Asian               Others                    0         0.711           1               0.035
            White               Others                    0         0.941           0               0.120
           BMI
            Healthy             Overweight                0         0.740           0               0.100
            Healthy             Obese                     0         0.580           1               0.035
            Overweight          Obese                     0         0.673           0               0.394
           Age
            Young               Middle age                0         0.078           1               0.002
            Young               Senior                    1         0.005           1               0.000
            Middle age          Senior                    0         0.165           0               0.051

           is a significant improvement compared to conventional   scans and just the ScandyPro scans respectively (Light
           anthropometric sized RPE where failure rates were found   stage scans were not used due to its small sample size),
           to be as high as double among females compared to male   and similar results were found.  This shows  that the
           colleagues [6-8] , or 16% – 54% among  Asians [11,13] . The   pipeline can produce demographically non-biased mask
           same analyses have been conducted for just the Bellus3D   models regardless of acquisition methods.

                                       International Journal of Bioprinting (2021)–Volume 7, Issue 4       129
   128   129   130   131   132   133   134   135   136   137   138