
Page 155 - IJB-8-1
P. 155
Lin, et al.
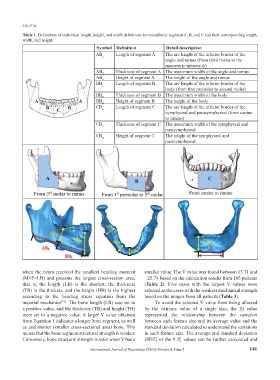
Table 1. Definitions of individual length, height, and width definitions for mandibular segment A, B, and C and their corresponding length,
width, and height.
Symbol Definition Detail description
AB L Length of segment A The arc length of the inferior border of the
angle and ramus (from third molar to the
masseteric tuberosity)
AB T Thickness of segment A The maximum width of the angle and ramus
AB H Height of segment A The height of the angle and ramus
BB L Length of segment B The arc length of the inferior border of the
body (from first premolar to second molar)
BB T Thickness of segment B The maximum width of the body
BB H Height of segment B The height of the body
CB Length of segment C The arc length of the inferior border of the
L
symphyseal and parasymphyseal (from canine
to canine)
CB T Thickness of segment C The maximum width of the symphyseal and
parasymphyseal
CB H Height of segment C The height of the symphyseal and
parasymphyseal
when the beam received the smallest bending moment smaller value. The V value was found between 13.71 and
(M=F×LB) and presents the largest cross-section area, −25.74 based on the calculation results from 105 patients
that is, the length (LB) is the shortest, the thickness (Table 2). Five cases with the largest V values were
(TB) is the thickest, and the height (HB) is the highest selected as the cases with the weakest mechanical strength
according to the bending stress equation from the based on the images from all patients (Table 3).
material mechanics . The bone length (LB) was set to To avoid the selected V value from being affected
[16]
a positive value, and the thickness (TB) and height (TH) by the extreme value of a single size, the Zj value
were set to a negative value. A larger V value obtained represented the relationship between the variation
from Equation 1 indicates a longer bone segment, as well between each feature size and its average value and the
as and shorter (smaller cross-sectional area) bone. This standard deviation calculated to understand the variations
means that the bone segment structural strength is weaker. in each feature size. The average and standard deviation
Conversely, bone structural strength is safer when V has a (SDZ) of the 9 Zj values can be further calculated and
International Journal of Bioprinting (2022)–Volume 8, Issue 1 141