
Page 160 - IJB-8-1
P. 160
Design Criteria for Patient-Specific Mandibular Implant
The core structure of C/B/A+B segments calculated The biomechanical test samples were divided into
using weighted topology optimization can be simplified the reconstructed implant (n=3) and traditional commercial
into a parametric equation based on the teeth positions bone plate group (n=3) (control group). The remaining
[21]
and the size of the bone segment to define the position mandibular ABS bone model of each defect segment
and size of the internal supporting beam structures. and the corresponding AM reconstructed implant and the
Taking area C as an example, a cross-section of the two control group (traditional bone plate; UniLock 2.4; Synthes,
supporting beams (a and b sizes at the Table 7 upper part) Umkirch, Germany) were fixed with a bone screw (Tandry
was set as a circle to ellipse from the buccal to lingual Locking Bone Plate System ψ2.4 mm L18 mm, All Micro
side. The corresponding center position was located at the Precision Co., Ltd., Taiwan) (2 column of Table 8). All
nd
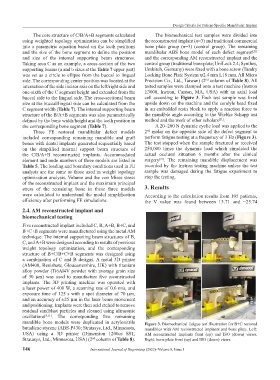
interaction of the side incisor axis on the left/right side and tested samples were clamped onto a test machine (Instron
one-sixth of the C segment height and extended from the E3000, Instron, Canton, MA, USA) with an axial load
buccal side to the lingual side. The cross-sectional beam cell according to Figure 3. Each test sample was fixed
size at the buccal/lingual side can be calculated from the upside down on the machine and the condyle head fixed
C segment width (Table 7). The internal supporting beam in an embedded resin block to apply a reaction force to
structure of the B/A+B segments was also parametrically the mandible angle according to the Wiebke Schupp test
[21]
defined by the bone width/height and the teeth position in method and the work of other scholars .
the corresponding bone segment (Table 7). A 20~200 N dynamic cyclic load was applied to the
Three FE restored mandibular defect models 2 molar on the opposite side of the defect segment to
nd
included corresponding remaining mandible and graft perform fatigue testing at a frequency of 3 Hz (Figure 3).
bones with dental implants generated sequentially based The test stopped when the sample fractured or received
on the simplified internal support beam structure of 250,000 times the dynamic load which simulated the
the C/B/A+B reconstructed implants. Accommodated actual occlusal situation 6 months after the clinical
element and node numbers of three models are listed in surgery . The remaining mandible displacement was
[21]
Table 5. The loading and boundary conditions used in FE recorded by the Instron testing machine unless the test
analysis are the same as those used in weight topology sample was damaged during the fatigue experiment to
optimization analysis. Volume and the von Mises stress stop the testing.
of the reconstructed implant and the maximum principal
stress of the remaining bone in these three models 3. Results
were calculated to understand the model simplification According to the calculation results from 105 patients,
efficiency after performing FE simulations. the V value was found between 13.71 and −25.74
2.4. AM reconstructed implant and
biomechanical testing
Five reconstructed implant included C, B, A+B, B+C, and
B+C+B segments were manufactured using the metal AM
technique. The internal supporting beam structures of B,
C, and A+B were designed according to results of previous
weight topology optimization, and the corresponding
structure of B+C/B+C+B segments was designed using
a combination of C and B designs. A metal 3D printer
(AM400, Renishaw, Gloucestershire, UK) with titanium
alloy powder (Ti6Al4V powder with average grain size
of 30 μm) was used to manufacture five reconstructed
implants. The 3D printing machine was operated with
a laser power of 400 W, a scanning rate of 0.6 m/s, and
exposure time of 125 s with a spot diameter of 70 μm,
and an accuracy of ±25 μm in the laser beam movement
and positioning. Implants were then acid etched to remove
residual sandblast particles and cleaned using ultrasonic
oscillations [8,11] . The corresponding five remaining
mandible bone models were duplicated in acrylonitrile Figure 3. Biomechanical fatigue test illustration for B+C restored
butadiene styrene (ABS-P430; Stratasys, Ltd., Minnesota, mandibles with AM reconstructed implants and bone plate. Left:
USA) using a 3D printer (Dimension 1200es SST, AM reconstructed implants front (up) and ISO (down) views.
Stratasys, Ltd., Minnesota, USA) (2 column of Table 8). Right: bone plate front (up) and ISO (down) views.
nd
146 International Journal of Bioprinting (2022)–Volume 8, Issue 1