
Page 161 - IJB-8-1
P. 161
Lin, et al.
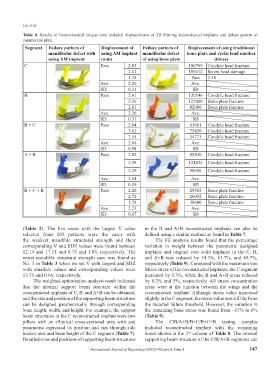
Table 8. Results of biomechanical fatigue tests included displacements of 3D Printing reconstructed implants and failure pattern of
commercial plate.
Segment Failure pattern of Displacement of Failure pattern of Displacement of using traditional
mandibular defect with using AM implant mandibular defect bone plate and cyclic load number
using AM implant (mm) of using bone plate (times)
C Pass 2.05 186769 Condyle head fracture
2.41 189412 Screw head damage
1.78 Pass 2.38
Ave. 2.26 Ave.
SD 0.31 SD
B Pass 2.61 120546 Condyle head fracture
2.16 125000 Bone plate fracture
2.01 82000 Bone plate fracture
Ave. 2.26 Ave.
SD 0.31 SD
B + C Pass 2.04 61661 Condyle head fracture
3.81 75450 Condyle head fracture
2.18 54773 Condyle head fracture
Ave. 2.68 Ave.
SD 0.98 SD
A + B Pass 2.85 85440 Condyle head fracture
2.58 124834 Condyle head fracture
2.49 58656 Condyle head fracture
Ave. 2.64 Ave.
SD 0.19 SD
B + C + B Pass 2.20 29585 Bone plate fracture
2.72 26032 Bone plate fracture
1.78 38680 Bone plate fracture
Ave. 2.23 Ave.
SD 0.47 SD
(Table 2). The five cases with the largest V value in the B and A+B reconstructed implants can also be
selected from 105 patients were the cases with defined using a similar method as found in Table 7.
the weakest mandible structural strength and their The FE analysis results found that the percentage
corresponding V and SDZ values were found between variation in weight between the parametric designed
12.14 and 17.51 and 0.78 and 1.06, respectively. The implants and original core solid implants in the C, B,
worst mandible structural strength case was found as and A+B was reduced by 54.3%, 63.7%, and 69.7%,
No. 3 in Table 3 when we set V with largest and SDZ respectively (Table 9). Compared with the maximum von
with smallest values and corresponding values were Mises stress of the reconstructed implants, the C segment
13.71 and 0.66, respectively. increased by 5.3%, while the B and A+B areas reduced
The weighted optimization analysis result indicated by 8.2% and 5%, respectively. All stress concentration
that the internal support beam structure within the areas were at the junction between the wings and the
reconstructed implants of C, B, and A+B can be obtained, reconstructed implant. Although stress value increased
and the size and position of the supporting beam structures slightly in the C segment, the stress value was still far from
can be designed parametrically through corresponding the material failure threshold. However, the variation in
bone length, width, and height. For example, the support the remaining bone stress was found from −17% to 0%
beam structures in the C reconstructed implant were two (Table 9).
pillars with an elliptical cross-sectional area with and The C/B/A+B/B+C/B+C+B testing samples
parametric expressed its position and size through side included reconstructed implant with the remaining
incisor axis and bone height of the C segment (Table 7). bones shown in the 2 column of Table 8. The internal
nd
Detailed sizes and positions of supporting beam structures supporting beam structure of the C/B/A+B segments can
International Journal of Bioprinting (2022)–Volume 8, Issue 1 147