
Page 171 - IJB-8-1
P. 171
Aihemaiti, et al.
A B C
D E F
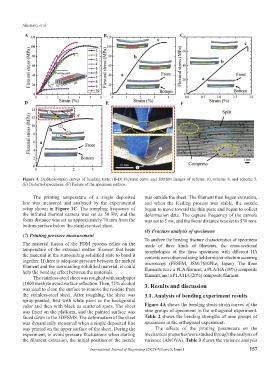
Figure 4. (A)Stress-strain curves of bending tests. (B-D) Flexural curve and 3DFSM images of scheme 10, scheme 8, and scheme 3.
(E) Distorted specimens. (F) Failure of the specimen surface.
The printing temperature of a single deposited was outside the sheet. The filament then began extrusion,
line was measured and analyzed by the experimental and when the feeding process was stable, the nozzle
setup shown in Figure 1C. The sampling frequency of began to move toward the thin plate and began to collect
the infrared thermal camera was set as 50 Hz, and the deformation data. The capture frequency of the camera
focus distance was set as approximately 70 mm from the was set to 5 ms, and the focus distance was set to 530 mm.
bottom surface below the stainless-steel sheet.
(8) Fracture analysis of specimens
(7) Printing pressure measurement
To analyze the bending fracture characteristics of specimens
The material fusion of the FDM process relies on the made of three kinds of filaments, the cross-sectional
temperature of the extruded molten filament that heats morphologies of the three specimens with different HA
the material in the surrounding solidified state to bond it contents were observed using field-emission electron scanning
together. If there is adequate pressure between the melted microscopy (FESEM, JSM-7610Plus, Japan). The three
filament and the surrounding solidified material, it could filaments were a PLA filament, a PLA/HA (10%) composite
help the bonding effect between the materials.
The stainless-steel sheet was roughed with sandpaper filament, and a PLA/HA (20%) composite filament.
(1800 mesh) to avoid surface reflection. Then, 75% alcohol 3. Results and discussion
was used to clean the surface to remove the residue from
the stainless-steel sheet. After roughing, the sheet was 3.1. Analysis of bending experiment results
spray-painted, first with white paint as the background
color and then with black as scattered spots. The sheet Figure 4A shows the bending stress-strain curves of the
was fixed on the platform, and the painted surface was nine groups of specimens in the orthogonal experiment.
faced down to the 3DFSMS. The deformation of the sheet Table 2 shows the bending strengths of nine groups of
was dynamically measured when a single deposited line specimens in the orthogonal experiment.
was printed on the upper surface of the sheet. During the The effects of the printing parameters on the
experiment, to avoid pressure fluctuations when starting mechanical properties were studied through the analysis of
the filament extrusion, the initial position of the nozzle variance (ANOVA). Table 3 shows the variance analysis
International Journal of Bioprinting (2022)–Volume 8, Issue 1 157