
Page 169 - IJB-8-1
P. 169
Aihemaiti, et al.
plane motion. The extruder was installed on the Z-axis filament feeding speed, were studied by an orthogonal
worktable. After slicing the 3D CAD model and setting experiment. Orthogonal experiments L9 with four
the scanning mode, a G-code file containing the printing factors and three levels were designed according to
path was generated and imported into the motion control our former research, as shown in Table 1. The nozzle
software of the 3D printer to start the printing. diameter of 0.4 mm, printing temperature of 210°C,
hotbed temperature of 40°C, and printing spacing
(2) Mechanical test and 3D full-field strain of 0.4 mm were set as the constant parameters in the
measurement setup experiments.
A mechanical testing machine (3005t, Shenzhen Regel
Instrument Co., Ltd., China) was used for three-point (2) Bending experiment
bending experiments. During the bending experiments, The cuboid specimens were designed according to the
a 3D full-field strain measurement system (3DFSMS) ISO 178-2018 test standard, and the specimen dimensions
(XTOP 3D Technology (Shenzhen) Co., Ltd.) was are 80 mm × 10 mm × 4 mm. Bending specimens of nine
applied to photograph and analyze the deformation and schemes according to the orthogonal experiment were
3D strains of the specimens, as shown in Figure 1B. The fabricated by the 3D printing platform as described in
system contained two camera groups, each with a pair Figure 1A. Five specimens were printed for each group
of cameras. The camera groups could cooperate with of process parameters.
each other to detect and analyze a sample from different The mechanical test and 3DFSM of the specimen
directions simultaneously. Camera group 1 captured were performed in the experimental setup shown
the front surface of the specimen, and camera group 2 in Figure 1B. According to the requirements of the
captured the lower surface of the bending specimen. test standard, the span of the bending specimens was
The surfaces of all the specimens were initially painted 64 mm, and the loading rate was 2 mm/min. The load
with white paint as a background, after which they were and displacement values of the tested specimen were
covered with a random black paint speckle pattern. recorded, and the bending stress and strain were calculated
(3) Printing temperature measurement setup according to the obtained load and displacement after the
bending experiments.
The printing temperature of a single deposited line was
measured and analyzed by an infrared thermal camera (3) Internal defect analysis of specimen
(FRIL A40). The experiment setup is shown in Figure 1C. The existence of pore defects in FDM printed parts is a
Single lines were deposited in the thin stainless-steel common problem. Therefore, different failure forms of
sheet (0.08 mm). When the nozzle deposited a line in the the specimens should be related to the internal defects.
stainless-steel sheet, the infrared thermal camera captured
the dynamic variation process of the temperature field on A micro-X-ray 3D imaging system (YXLON Cheetah,
Germany) was used to detect and reconstruct the internal
the bottom surface of the sheet during the printing process.
defects of the specimens, and the internal pore geometries,
(4) Printing pressure measurement setup volumes, and spatial distributions were also analyzed.
To compare the printing pressures of different process Figure 2A shows the diagram of the sampling area for
the defect analysis obtained using the micro-X-ray 3D
parameters, 3DFSMS was used to measure the deformation imaging system. The scanning range was 10 mm × 7 mm
of stainless-steel sheets (0.08 mm) during the single- × 3 mm. A scan resolution of 15 μm, a peak tube potential
line deposition. The experimental setup is similar to the of 80 kV, and a target current of 62.5 μA were set as the
temperature measurement setup shown in Figure 1D. basic measurement parameters.
2.3. Experiment methods (4) Analysis of cross-sectional geometry of the single
(1) Orthogonal experimental design deposited line
Four important process parameters, including the HA In FDM printing, the molten material is extruded from the
content (mass ratio), layer thickness, printing speed, and nozzle, and a line is deposited on the hotbed (or the front
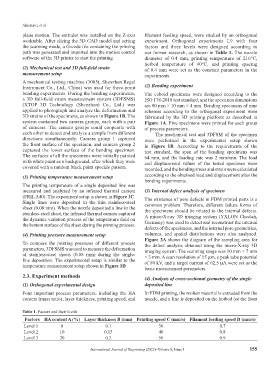
Table 1. Factors and their levels
Factors HA content A (%) Layer thickness B (mm) Printing speed C (mm/s) Filament feeding speed D (mm/s)
Level 1 0 0.1 30 0.7
Level 2 10 0.15 40 0.8
Level 3 20 0.2 50 0.9
International Journal of Bioprinting (2022)–Volume 8, Issue 1 155