
Page 172 - IJB-8-1
P. 172
Optimization of 3D Printing Parameters of PLA/HA Bone Plates
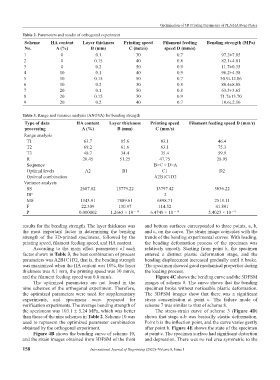
Table 2. Parameters and results of orthogonal experiment
Scheme HA content Layer thickness Printing speed Filament feeding Bending strength (MPa)
No. A (%) B (mm) C (mm/s) speed D (mm/s)
1 0 0.1 30 0.7 97.2±7.85
2 0 0.15 40 0.8 82.1±4.81
3 0 0.2 50 0.9 11.7±0.35
4 10 0.1 40 0.9 96.2±4.58
5 10 0.15 50 0.7 30.9±12.86
6 10 0.2 30 0.8 80.4±8.08
7 20 0.1 50 0.8 63.5±3.65
8 20 0.15 30 0.9 71.7±13.70
9 20 0.2 40 0.7 10.6±2.16
Table 3. Range and variance analysis (ANOVA) for bending strength
Type of data HA content Layer thickness Printing speed Filament feeding speed D (mm/s)
processing A (%) B (mm) C (mm/s)
Range analysis
T1 63.7 85.6 83.1 46.4
T2 69.2 61.6 63.1 75.3
T3 48.7 34.4 35.4 59.9
R 20.45 51.25 47.75 28.95
Sequence B>C > D>A
Optimal levels A2 B1 C1 D2
Optimal combination A2B1C1D2
Variance analysis
SS 2687.82 15779.22 13797.42 5036.22
DF 2
MS 1343.91 7889.61 6898.71 2518.11
F 22.309 130.97 114.52 41.801
P 0.000002 1.2663 × 10 − 14 6.4749 × 10 − 14 5.4023 × 10 − 9
results for the bending strength. The layer thickness was and bottom surfaces corresponded to three points, a, b,
the most important factor in determining the bending and c, on the curve. The strain image coincides with the
strength of the 3D-printed specimens, followed by the trends of the bending experimental curves. With loading,
printing speed, filament feeding speed, and HA content. the bending deformation process of the specimen was
According to the main effect parameters of each relatively smooth. Starting from point b, the specimen
factor shown in Table 3, the best combination of process entered a distinct plastic deformation stage, and the
parameters was A2B1C1D2, that is, the bending strength bending displacement increased gradually until it broke.
was maximized when the HA content was 10%, the layer The specimen showed good mechanical properties during
thickness was 0.1 mm, the printing speed was 30 mm/s, the loading process.
and the filament feeding speed was 0.8 mm/s. Figure 4C shows the bending curve and the 3DFSM
The optimized parameters are not found in the images of scheme 8. The curve shows that the bending
nine schemes of the orthogonal experiment. Therefore, specimen broke without noticeable plastic deformation.
the optimized parameters were used for supplementary The 3DFSM images show that there was a significant
experiments, and specimens were prepared for stress concentration at point c. The failure mode of
verification experiments. The average bending strength of scheme 7 was similar to that of scheme 8.
the specimens was 103.1 ± 5.24 MPa, which was better The stress-strain curve of scheme 3 (Figure 4D)
than those of the nine schemes in Table 2. Scheme 10 was shows that stage a-b was basically elastic deformation.
used to represent the optimized parameter combination Point b is the inflection point, and the curve varies gently
obtained by the orthogonal experiment. after point b. Figure 4E shows the state of the specimen
Figure 4B shows the bending curve of scheme 10, at point c. The specimen surface had significant distortion
and the strain images obtained from 3DFSM of the front and depression. There was no red area symmetric to the
158 International Journal of Bioprinting (2022)–Volume 8, Issue 1