
Page 59 - IJB-8-1
P. 59
Iversen, et al.
A
B
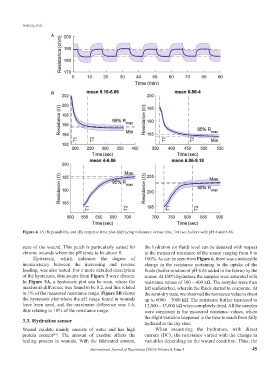
Figure 4. (A) Repeatability and (B) response time plot displaying resistance versus time, for two buffers with pH 4 and 6.86.
state of the wound. This patch is particularly suited for the hydration (or fluid) level can be detected with respect
chronic wounds where the pH tends to be above 8. to the measured resistance of the sensor ranging from 0 to
Hysteresis, which indicates the degree of 100%. As can be seen from Figure 6, there was a noticeable
inconsistency between the increasing and reverse change in the resistance pertaining to the uptake of the
loading, was also tested. For a more detailed description fluids (buffer solution of pH 6.86 added to the fabric) by the
of the hysteresis, data points from Figure 3 were chosen. sensor. At 100% hydration, the samples were saturated with
In Figure 5A, a hysteresis plot can be seen, where the resistance values of 300 – 400 kΩ. The samples were then
maximum difference was found to be 0.2, and this related left undisturbed, wherein the fluids started to evaporate. At
to 1% of the measured resistance range. Figure 5B shows the semi-dry state, we observed the resistance value to shoot
the hysteresis plot where the pH range found in wounds up to 6000 – 7000 kΩ. The resistance further increased to
have been used, and the maximum difference was 1.6, 12,000 – 13,000 kΩ when completely dried. All the samples
thus relating to 10% of the resistance range. were consistent in the measured resistance values, where
the slight variation happened in the time to reach from fully
3.3. Hydration sensor hydrated to the dry state.
Wound exudate mainly consists of water and has high When measuring the hydration, with direct
protein content . The amount of exudate affects the current (DC), the resistance varied with the change in
[63]
healing process in wounds. With the fabricated sensors, variables depending on the wound condition. Thus, the
International Journal of Bioprinting (2022)–Volume 8, Issue 1 45