
Page 58 - IJB-8-1
P. 58
3D Printed Electronic Patch for pH and Hydration Sensing
3.2. pH sensor and characteristics A B
PDMS was chosen as substrate because of its mechanical
and biocompatibility properties. However, there is
a downside of using PDMS as a substrate due to its
hydrophobic properties, which impede the printing
of SWCNT. The presence of metal in nano-form or
introduction of silano group is known to introduce
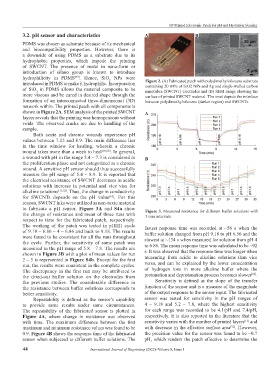
hydrophilicity in PDMS . Hence, SiO NPs were Figure 2. (A) Fabricated patch with polydimethylsiloxane substrate
[59]
2
introduced in PDMS to make it hydrophilic. Incorporation containing 20 wt% of SiO2 NPs and Ag and single-walled carbon
of SiO in PDMS allows the material composite to be nanotubes (SWCNT) electrodes and (B) SEM image showing the
2
more viscous and be cured in desired shape through the surface of printed SWCNT material. The inset depicts the interface
formation of an interconnected three-dimensional (3D) between polydimethylsiloxane (darker region) and SWCNTs.
network within. The printed patch with all components is
shown in Figure 2A. SEM analysis of the printed SWCNT A
layers reveals that the printing was homogeneous without
voids. The observed cracks are due to handling of the
sample.
Both acute and chronic wounds experience pH
values between 7.15 and 8.9. The main difference lies
in the time window for healing, wherein a chronic
wound takes more than a week to heal [10,60] . In general,
a wound with pH in the range 5.4 – 7.3 is considered in B
the proliferation phase and not categorized as a chronic
wound. A sensitive pH sensor should thus successfully
measure the pH range of 5.4 – 8.9. It is reported that
the electrical resistance of SWCNT decreases in acidic
solutions with increase in potential and vice visa for
alkaline solutions [11,52] . Thus, the change in conductivity
for SWCNTs depends on the pH value [61] . For this
reason, SWCNT inks were utilized as non-toxic material
to fabricate a pH sensor. Figure 3A and S4a show Figure 3. Measured resistance for different buffer solutions with
the change of resistance and mean of three runs with 3 min intervals.
respect to time for the fabricated patch, respectively.
The working of the patch was tested in pHHH cycle fastest response time was recorded at ~56 s when the
of 9.18 – 6.86 – 4 – 6.86 and back to 9.18. The results buffer solution changed from pH 9.18 to pH 6.56 and the
were found to be consistent for all the runs throughout slowest at ~134 s when measured for solution from pH 4
the cycle. Further, the sensitivity of same patch was to 6.86. The mean response time was calculated to be ~92
measured in the pH range of 5.8 – 7.8. The results are
shown in Figure 3B with a plot of mean values for run s. It was observed that the response time was longer when
2 – 5 is represented in Figure S4b. Except for the first measuring from acidic to alkaline solutions than vice
run, the results were consistent in the complete cycles. versa, and can be explained by the lower concentration
The discrepancy in the first run may be attributed to of hydrogen ions in more alkaline buffer where the
[62]
the dried-out buffer solution on the electrodes from protonation and deprotonation process becomes slower .
the previous studies. The considerable difference in Sensitivity is defined as the slope of the transfer
the resistance between buffer solutions corresponds to function of the sensor and is a measure of the magnitude
better sensitivity. of the output response to the sensor input. The fabricated
Repeatability is defined as the sensor’s capability sensor was tested for sensitivity in the pH ranges of
to provide same results under same circumstances. 4 – 9.18 and 5.2 – 7.8, where the highest sensitivity
The repeatability of the fabricated sensor is plotted in for each range was recorded to be 4.1/pH and 7.4/pH,
Figure 4A, where change in resistance was observed respectively. It is also reported in the literature that the
with time. The maximum difference between the first sensitivity varies with the number of printed layers and
[11]
maximum and minimum resistance values was found to be with decrease in the effective surface area . However,
[52]
0.9. Figure 4B shows the response time of the fabricated the precision value for the sensor was found to be ~0.7
sensor when subjected to different buffer solutions. The pH, which renders the patch effective to determine the
44 International Journal of Bioprinting (2022)–Volume 8, Issue 1