
Page 83 - IJB-8-1
P. 83
Liu, et al.
Table 2. Dimensions of samples obtained from L-PBF with
different correction factors
Correction Length Width Height
Factor (mm)
0.996 4.02±0.02 5.01±0.02 8.05±0.00
0.998 4.07±0.02 5.05±0.03 8.07±0.02
1.000 4.04±0.04 5.07±0.04 8.10±0.03
1.002 4.05±0.03 5.09±0.02 8.08±0.02
Figure 2. Stripe scanning strategy used in L-PBF shows the fill 1.004 4.02±0.02 5.08±0.05 8.08±0.04
contour and boarder offset, as well as the hatch spacing which is the
distance between the two adjacent laser scan tracks. Table 3. Percentage accuracy of samples in the three different
groups
A B C Group Accuracy Min Max
Comparison (%) (%) (%)
Overall group 68.70%±5.63 −0.53±0.24 0.32±0.07
(Printed versus
actual tooth)
Printed group 90.59%±4.75 −0.12±0.10 0.27±0.06
(Segmented
versus printed
Figure 3. Sample design used for preliminary studies to obtain the tooth)
correction factor. (A) Isometric view. (B) Top view. (C) Side view. Segmentation 66.91%±10.51 −0.53±0.25 0.50±0.17
group
(Segmented
versus actual
tooth)
the additional imaging, segmentation, optimization of
these steps and the “3D printing” stage that involves
STL file preparation, the fabrication process, and post-
processing which may include polishing, safety testing,
and evaluation and finally, implant approval.
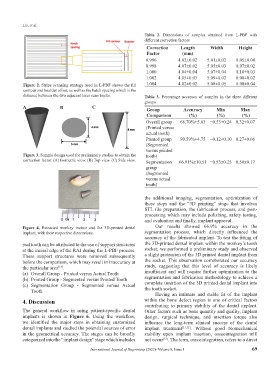
Figure 4. Extracted monkey incisor and the 3D-printed dental Our results showed 66.9% accuracy in the
implant, with their respective dimensions. segmentation process, which directly influenced the
accuracy of the fabricated implant. To test the fitting of
real tooth can be attributed to the use of support structures the 3D-printed dental implant within the monkey’s tooth
at the incisal edge of the RAI during the L-PBF process. socket, we performed a preliminary study and observed
These support structures were removed subsequently a slight protrusion of the 3D printed dental implant from
before the comparison, which may result in inaccuracy at the socket. This observation corroborated our accuracy
the particular area . study, suggesting that this level of accuracy is likely
[13]
(a) Overall Group - Printed versus Actual Tooth insufficient and will require further optimization to the
(b) Printed Group - Segmented versus Printed Tooth segmentation and fabrication methodology to achieve a
(c) Segmentation Group - Segmented versus Actual complete insertion of the 3D printed dental implant into
Tooth the tooth socket.
Having an intimate and stable fit of the implant
4. Discussion within the bone defect region is one of critical factors
contributing to primary stability of the dental implant.
The general workflow in using patient-specific dental Other factors such as bone quantity and quality, implant
implants is shown in Figure 6. Using the workflow, design, surgical technique, and insertion torque also
we identified the major steps in obtaining customized influence the long-term clinical success of the dental
dental implants and studied the potential sources of error implant treatment [21,22] . Without good biomechanical
in the geometrical accuracy. The stages can be broadly stability upon implant insertion, osseointegration will
categorized into the “implant design” stage which includes not occur . The term, osseointegration, refers to a direct
[12]
International Journal of Bioprinting (2022)–Volume 8, Issue 1 69