
Page 175 - IJB-8-2
P. 175
Tröndle Kevin, et al.
A
B C
D E
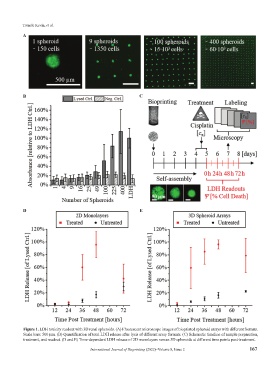
Figure 1. LDH toxicity readout with 3D renal spheroids. (A) Fluorescent microscope images of bioprinted spheroid arrays with different formats.
Scale bars: 500 µm. (B) Quantification of total LDH release after lysis of different array formats. (C) Schematic timeline of sample preparation,
treatment, and readout. (D and E) Time-dependent LDH release of 2D monolayers versus 3D spheroids at different time points post-treatment.
International Journal of Bioprinting (2022)–Volume 8, Issue 2 167