
Page 177 - IJB-8-2
P. 177
Tröndle Kevin, et al.
membrane lysis occurs, which leads to the release Ψ as output. The hyperparameters of the training
of LDH. Since the lysis of the cell membrane is pipeline were tuned via Bayesian Optimization [20] ,
considered the final step of cell death, this assumption as implemented by (Bayesian Optimization with
is plausible. A cisplatin serial dilution was prepared in Hyperband [BOHB] [20] ). The hyperparameter search
REGM, and the treatment was conducted according space and the optimum configuration found by BOHB
to the process and timeline described in Figure 1C. are shown in the Table S2. The following results
Three replicates of each treatment condition were originate from this configuration. The dataset was split
used for microscopic observations. For the KIM-1 for training and testing in the proportions of 80 – 20%,
nephrotoxicity marker expression assessment, samples respectively. The images were cropped to 450 × 450 px
were fixed (PFA 4%, 1 h) before immunolabeling was with the spheroid positioned at the center of the image.
performed. Representative false-color images of the Online data augmentation was used. At each epoch, the
observed spheroid morphologies for different treatment images were randomly transformed within the ranges
concentrations are shown in Figure 3. The observations as shown in the Table S3. Training was conducted for
showed a disintegration of the spheroids at treatment 90 epochs, which resulted in a test mean squared error
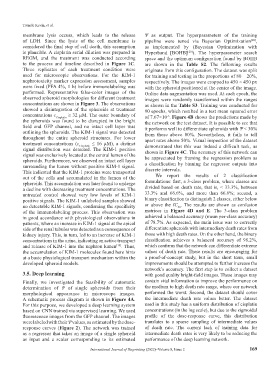
concentrations c Cisplatin ≥ 32 µM. The outer boundary of of 7.67×10 . Figure 4B shows the predictions made by
-3
the spheroids was found to be disrupted in the bright the network on the test dataset. It is possible to see that
field and GFP channel, and no intact cell layer was it performs well to differentiate spheroids with Ψ < 30%
outlining the spheroids. The KIM-1 signal was detected from those above 80%. Nevertheless, it fails to tell
throughout the entire spheroid structures. For lower apart rates above 50%. Visual inspection of the dataset
treatment concentrations (c Cisplatin ≤ 16 µM), a distinct demonstrated that this was indeed a difficult task, as
signal distribution was detected. The KIM-1 positive shown in Figure 4C. The accuracy of this network can
signal was exclusively located at the central lumen of the be appreciated by framing the regression problem as
spheroids. Furthermore, we observed an intact cell layer
surrounding the lumen without positive KIM-1 signal. a classification by binning the regressor outputs into
This indicated that the KIM-1 proteins were transported discrete intervals.
out of the cells and accumulated in the lumen of the We report the results of 2 classification
spheroids. This accumulation was later found to undergo formulations: first, a 3-class problem, where classes are
a decline with decreasing treatment concentrations. The divided based on death rate, that is, < 33.3%, between
untreated control showed very low levels of KIM-1 33.3% and 66.6%, and more than 66.6%; second, a
positive signals. The KIM-1 unlabeled samples showed binary classification to distinguish 2 classes, either below
no detectable KIM-1 signals, confirming the specificity or above the IC . The results are shown as confusion
50
of the immunolabeling process. This observation was matrices in Figure 4D and E. The 3-class problem
in good accordance with physiological observations in achieved a balanced accuracy (mean per-class accuracy)
patients, where an increase in KIM-1 signal at the apical of 78.7%. As expected, the main issue was to correctly
side of the renal tubules was detected as a consequence of differentiate spheroids with intermediary death rates from
kidney injury. This, in turn, led to an increase of KIM-1 those with high death rates. On the other hand, the binary
concentrations in the urine, indicating an active transport classification achieves a balanced accuracy of 98.2%,
and release of KIM-1 into the nephron lumen [19] . Thus, which confirms that the network can differentiate extreme
the accumulation of KIM-1 molecules found here hints values of death rate. These results are encouraging for
at a basic physiological transport mechanism within the a proof-of-concept study, but in the short term, small
developed spheroid models. improvements should be attempted to further increase the
network’s accuracy. The first step is to collect a dataset
3.5. Deep learning with good quality bright-field images. These images may
Finally, we investigated the feasibility of automatic contain vital information to improve the performance on
determination of Ψ of single spheroids from their the medium to high death rate range, where our network
morphological appearance in microscope images. performed the worst. Second, the dataset should cover
A schematic process diagram is shown in Figure 4A. the intermediate death rate values better. The dataset
For this purpose, we developed a deep learning system used in this study has a uniform distribution of cisplatin
based on CNN trained via supervised learning. We used concentrations (in the log scale), but due to the sigmoidal
fluorescence images from the GFP channel. The images profile of the dose-response curve, this distribution
were labeled with their Ψ values, as estimated by the dose- translates to a sparse sampling of intermediate values
response curves (Figure 2). The network was trained of death rate. The current lack of training data for
as a regressor that takes an image of a single spheroid intermediate death rates is very likely to be reducing the
as input and a scalar corresponding to its estimated performance of the deep learning network.
International Journal of Bioprinting (2022)–Volume 8, Issue 2 169