
Page 176 - IJB-8-2
P. 176
Nephrotoxicity Testing with Bioprinted Renal Spheroids
models. For head-to-head comparison, three parameters the 3D bioprinted models were in good accordance with
were used, including the inhibitory concentration leading the previously published data. In other studies, reported
[17]
[3]
to 50% cell death (IC ), and the maximum and minimum values were 5.72 µM , between 10 and 50 µM ,
50
[18]
response (E max , E ). As described in literature, clinically or > 30 µM . It should be noted that each of the
min
relevant cisplatin concentrations were in the range of reported data was based on experiments on different cell
10 µM . Based on this value, we prepared a dilution types, treatment protocols, and readout methods. Thus,
[16]
series (c Cisplatin = 0.075, 0.5, 1, 2, 4, 8, 16, 32, 64, and a quantitative head-to-head comparison would not be
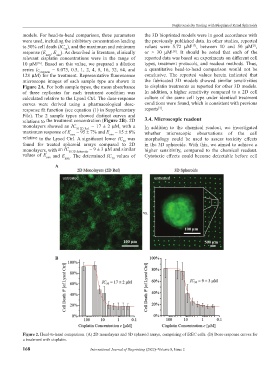
128 µM) for the treatment. Representative fluorescence conclusive. The reported values herein indicated that
microscope images of each sample type are shown in the fabricated 3D models showed similar sensitivities
Figure 2A. For both sample types, the mean absorbance to cisplatin treatments as reported for other 3D models.
of three replicates for each treatment condition was In addition, a higher sensitivity compared to a 2D cell
calculated relative to the Lysed Ctrl. The dose-response culture of the same cell type under identical treatment
curves were derived using a pharmacological dose- conditions were found, which is consistent with previous
[3]
response fit function (see equation (1) in Supplementary reports .
File). The 2 sample types showed distinct curves and
relations to the treatment concentration (Figure 2B). 2D 3.4. Microscopic readout
monolayers showed an IC 50 2D Ref. = 17 ± 2 µM, with a In addition to the chemical readout, we investigated
maximum response of E max = 95 ± 7% and E = 15 ± 8% whether microscopic observations of the cell
min
relative to the Lysed Ctrl. A significant lower IC was morphology could be used to assess toxicity effects
50
found for treated spheroid arrays compared to 2D in the 3D spheroids. With this, we aimed to achieve a
monolayers, with an IC 50 3D Spheroids = 9 ± 3 µM and similar higher sensitivity, compared to the chemical readout.
values of E max . The determined IC values of Cytotoxic effects could become detectable before cell
min and E
50
A
B
Figure 2. Head-to-head comparison. (A) 2D monolayers and 3D spheroid arrays, comprising of iREC cells. (B) Dose-response curves for
a treatment with cisplatin.
168 International Journal of Bioprinting (2022)–Volume 8, Issue 2