
Page 179 - IJB-8-2
P. 179
Tröndle Kevin, et al.
A
B
C
D E
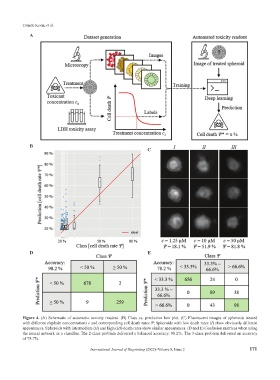
Figure 4. (A) Schematic of automatic toxicity readout. (B) Class vs. prediction box plot. (C) Fluorescent images of spheroids treated
with different cisplatin concentrations c and corresponding cell death rates Ψ: Spheroids with low death rates (I) show obviously different
appearances. Spheroids with intermediate (II) and high (III) death rates show similar appearances. (D and E) Confusion matrices when using
the neural network as a classifier. The 2-class problem delivered a balanced accuracy: 98.2%. The 3-class problem delivered an accuracy
of 78.7%.
International Journal of Bioprinting (2022)–Volume 8, Issue 2 171