
Page 27 - IJB-8-2
P. 27
Huang, et al.
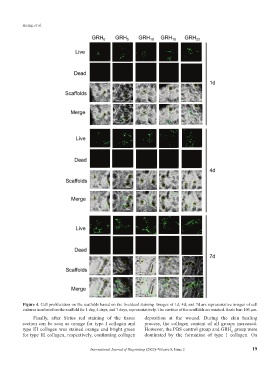
Figure 4. Cell proliferation on the scaffolds based on the live/dead staining. Images of 1d, 4d, and 7d are representative images of cell
cultures incubated on the scaffold for 1 day, 4 days, and 7 days, representatively. The cavities of the scaffolds are marked. Scale bar: 100 μm.
Finally, after Sirius red staining of the tissue deposition at the wound. During the skin healing
section can be seen as orange for type I collagen and process, the collagen content of all groups increased.
type III collagen was stained orange and bright green However, the PBS control group and GRH group were
0
for type III collagen, respectively, confirming collagen dominated by the formation of type I collagen. On
International Journal of Bioprinting (2022)–Volume 8, Issue 2 19