
Page 265 - IJB-8-3
P. 265
Kriegel, et al.
solution was supplemented with 0.5 μg and 5 μg BSP 2.6. Histology
or 2 μg BMP-7, respectively, and pipetted manually 2.6.1. Calvaria model
into the 3D-printed PLA cylinder and polymerized at
room temperature for 30 min. Figure 1A shows the After radiologic analysis, the skulls were decalcified
printed cylinder filled with collagen corresponding to using a 10% EDTA solution for at least 8 weeks, with
nd
an excised piece of rat femur. For release kinetics, the the solution exchanged every 2 day during the first
cylinder loaded with BSP was placed in 500 μL PBS. 2 weeks and then weekly. The skulls were dehydrated by
Complete supernatants were collected and replaced the Sakura VIP E150 Tissue Processor (Sakura Finetek
by fresh PBS after 1, 2, 4, 24, 48, and 72 h and the GmbH, Rüsselsheim, Germany) and then embedded
BSP content was measured using a specific ELISA in paraffin wax. The resulting blocks were cut in 5 μm
(Immundiagnostik, Bensheim, Germany) as described slices, deparaffinized, and then stained with hematoxylin
by the manufacturer. The release was calculated as and eosin (HE).
percentage in relation to the loaded amount of BSP, 2.6.2. Femora model
which was set to 100%.
Fifty-two 10-week-old Wistar rats (Janvier, Femora were sent to LLS Rowiak (Hannover, Germany)
France) were acclimatized for 3 days before they were for laser-based dissection and histology (HE and Masson-
subdivided into four groups according to Table S3 (as Goldner trichrome staining). Quantification of bone
negative controls an empty defect [n = 6] and PLA alone area was performed with ImageJ and the plugin color
[n = 6], as test groups PLA + collagen alone [n = 10] deconvolution 2.
or loaded with two different BSP concentrations and
as positive control loaded with BMP-7 [each n = 10]). 2.7. Masson-Goldner Trichrome Staining
Anesthesia was performed as described above. To create Nuclei were stained for 5 min with hematoxylin according
the desired femoral osteotomy of 6 mm in length, we to Weigert, washed with 1% acetic acid followed
used the rat fix system (RISystem, Davos, Switzerland) by Ponceau-S staining (Sigma-Aldrich, Darmstadt,
as described before [26] . The PLA cylinder was set in the Germany) for 10 min. After another washing step with
defect without further fixation (Figure 1B, arrow). The acetic acid (1%), samples were placed in acid orange G
wound was closed with resorbable Vicryl sutures 4-0 solution (Carl Roth, Karlsruhe, Germany) for 10 min.
(Ethilon, Ethicon, Norderstedt, Germany). X-rays were After rinsing in 1% acetic acid, samples were stained
performed directly after surgery (Figure 1C, the PLA with light green (Merck Chemicals GmbH, Darmstadt,
cylinder is not visible in the X-ray, but its position is Germany) for 10 min, then rinsed again in 1% acetic acid
marked with the arrow) and after 2, 4, and 8 weeks. The for 30 s.
rats were sacrificed 4 (n = 26) and 8 weeks (n = 26)
after surgery by exposure to CO . Femora were placed 2.8. Elastica van Gieson staining
2
in 4.5% paraformaldehyde solution for μCT and Nuclei were stained for 5 min with hematoxylin according
histological analyses. to Weigert then rinsed with distilled water for 10 min.
Bone formation was evaluated using a high- After staining with resorcinol-fuchsine solution (Waldeck
resolution microcomputed tomography (μCT) scanner GmbH and Co. KG, Münster, Germany), samples were
(CT 40, SCANCO Medical AG, Brüttisellen, Switzerland) again rinsed with distilled water for 10 min. Then, samples
and analyzed as described before . For generation were incubated with van Gieson solution (fuchsin-picric
[26]
of 3D graphics, the software Osirix (aycan, Würzburg, acid; Waldeck GmbH & Co. KG, Münster, Germany) for
Germany) was used. 5 min, dehydrated in alcohols, cleared, and mounted.
A B C 2.9. Statistical analyses
Statistical analyses were performed using the SPSS
software (IBM, Version 23) or GraphPad Prism software.
The results are presented as medians and quartiles or as
means ± standard deviation. Measurements were carried
out in triplicates, except for ELISA measurements
(duplicate). Cell-based experiments were independently
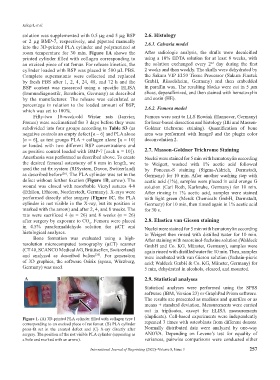
Figure 1. (A) 3D-printed PLA cylinder filled with collagen type I
corresponding to an excised piece of rat femur. (B) PLA cylinder repeated 3 times with osteoblasts from different donors.
press-fit set in the created defect and (C) X-ray directly after Normally distributed data were analyzed by one-way
surgery. The position of the not visible PLA cylinder (appearing as ANOVA. Depending on Levene’s test for equality of
a hole and marked with an arrow). variances, pairwise comparisons were conducted either
International Journal of Bioprinting (2022)–Volume 8, Issue 3 257