
Page 25 - IJB-9-1
P. 25
International Journal of Bioprinting Biocompatible materials and Multi Jet Fusion
A B H
C D
E F
G
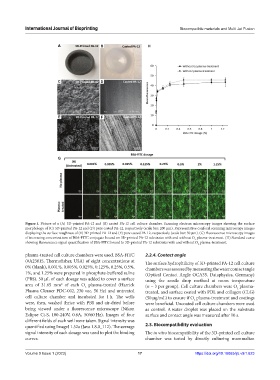
Figure 1. Picture of a (A) 3D-printed PA-12 and (B) casted PA-12 cell culture chamber. Scanning electron microscopy images showing the surface
morphology of (C) 3D-printed PA-12 and (D) pure casted PA-12, respectively (scale bar: 200 µm). Representative confocal scanning microscopy images
displaying the surface roughness of (E) 3D-printed PA-12 and (F) pure casted PA-12, respectively (scale bar: 50 µm). (G) Fluorescence microscopy images
of increasing concentrations of BSA-FITC conjugate bound on 3D-printed PA-12 substrates with and without O plasma-treatment. (H) Standard curve
2
showing fluorescence signal quantification of BSA-FITC bound to 3D-printed PA-12 substrates with and without O plasma-treatment.
2
plasma-treated cell culture chambers were used. BSA-FITC 2.2.4. Contact angle
(#A23015, Thermofisher, USA) of eight concentrations at The surface hydrophilicity of 3D-printed PA-12 cell culture
0% (blank), 0.001%, 0.005%, 0.025%, 0.125%, 0.25%, 0.5%, chambers was assessed by measuring the water contact angle
1%, and 1.25% were prepared in phosphate-buffered saline (Optical Contact Angle OCA35, Dataphysics, Germany)
(PBS). 50 µL of each dosage was added to cover a surface using the sessile drop method at room temperature
2
area of 31.65 mm of each O plasma-treated (Harrick (n = 3 per group). Cell culture chambers were O plasma-
2
2
Plasma Cleaner PDC-002, 230 vac, 50 Hz) and untreated treated, and surface coated with PDL and collagen (CLG)
cell culture chamber and incubated for 1 h. The wells (50 µg/mL) to ensure if O plasma-treatment and coatings
2
were, then, washed thrice with PBS and air-dried before were beneficial. Uncoated cell culture chambers were used
being viewed under a fluorescence microscope (Nikon as control. A water droplet was placed on the substrate
Eclipse Ci-S, 100-240V, 0.8A, 50/60 Hz). Images of four surface and contact angle was measured after 10 s.
different fields of each well were taken. Signal intensity was
quantified using ImageJ 1.52a (Java 1.8.0_112). The average 2.3. Biocompatibility evaluation
signal intensity of each dosage was used to plot the binding The in vitro biocompatibility of the 3D-printed cell culture
curves. chamber was tested by directly culturing mammalian
Volume 9 Issue 1 (2023) 17 https://doi.org/10.18063/ijb.v9i1.623