
Page 422 - IJB-9-3
P. 422
International Journal of Bioprinting 3DP PILF cage for osteoporotic
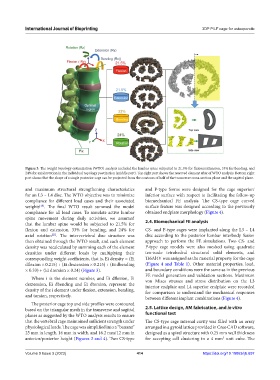
Figure 3. The weight topology optimization (WTO) analysis included the lumbar spine subjected to 21.5% for flexion/extension, 33% for bending, and
24% for axial rotation in the individual topology poetization (middle part). Top right part shows the reserved element after of WTO analysis. Bottom right
part shows that the shape of a single posterior cage can be projected from the contours of half of the transverse cross-section plane and the sagittal plane.
and maximum structural strengthening characteristics and P-type forms were designed for the cage superior/
for an L3 – L4 disc. The WTO objective was to minimize inferior surface with respect to facilitating the follow-up
compliance for different load cases and their associated biomechanical FE analysis. The CS-type cage curved
weights . The final WTO result summed the model surface feature was designed according to the previously
[20]
compliance for all load cases. To simulate active lumbar obtained endplate morphology (Figure 4).
spine movement during daily activities, we assumed
that the lumbar spine would be subjected to 21.5% for 2.4. Biomechanical FE analysis
flexion and extension, 33% for bending, and 24% for CS- and P-type cages were implanted along the L3 – L4
axial rotation . The intervertebral disc structure was disc according to the posterior lumbar interbody fusion
[21]
then obtained through the WTO result, and each element approach to perform the FE simulations. Two CS- and
density was recalculated by summing each of the element P-type cage models were also meshed using quadratic
densities under different loads by multiplying their ten-node tetrahedral structural solid elements, and
corresponding weight coefficients, that is, Ei density = (Ei Ti6Al4V was assigned as the material property for the cage
dflexion × 0.215) + (Ei dextension × 0.215) + (Ei dbending (Figure 4 and Table 1). Other material properties, load,
× 0.33) + (Ei dtorsion × 0.24) (Figure 3). and boundary conditions were the same as in the previous
FE model generation and validation sections. Maximum
Where i is the element number, and Ei dflexion, Ei
dextension, Ei dbending and Ei dtorsion, represent the von Mises stresses and stress distribution on the L3
interior endplate and L4 superior endplate were recorded
density of the i element under flexion, extension, bending, for comparison to understand the mechanical responses
and torsion, respectively. between different implant combinations (Figure 4).
The posterior cage top and side profiles were contoured
based on the triangular mesh in the transverse and sagittal 2.5. Lattice design, AM fabrication, and in vitro
planes as suggested by the WTO analysis results to ensure functional test
that the vertebral cage maintained sufficient strength under The CS-type cage internal cavity was filled with an array
physiological loads. The cage was simplified into a “banana” arranged in a gyroid lattice provided in Creo CAD software,
25 mm in length, 16 mm in width, and 16.2 mm/12 mm in designed as a spiral structure with 0.25 mm wall thickness
anterior/posterior height (Figures 3 and 4). Two CS-type for accepting cell clustering in a 4 mm unit cube. The
3
Volume 9 Issue 3 (2023) 414 https://doi.org/10.18063/ijb.697