
Page 273 - IJB-9-4
P. 273
International Journal of Bioprinting 3D acoustically assembled cell spheroids with high-throughput
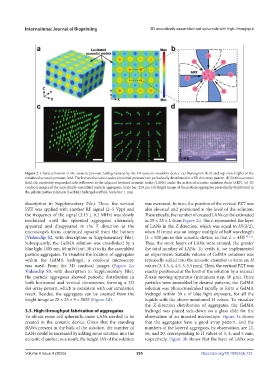
Figure 2. Characterization of the acoustic pressure field generated by the 3D acoustic assembly device. (a) Stereogram (left) and top view (right) of the
simulated acoustic pressure field. The levitated acoustic nodes (minimal pressure) are periodically distributed in a 3D dot-array pattern. (b) In this acoustic
field, the randomly suspended cells will move to the adjacent levitated acoustic nodes (LANs) under the action of acoustic radiation force (ARF). (c) 3D
confocal images of the acoustically assembled particle aggregates. Scale bar: 250 μm. (d) Bright image of the particle aggregates periodically distributed in
the gelatin methacrylamide (GelMA) hydrogel scaffold. Scale bar: 1 mm.
description in Supplementary File). Then, the vertical was increased. In turn, the position of the vertical PZT was
PZT was applied with another RF signal (2–5 Vpp) and also elevated and positioned at the level of the solution.
the frequency of the signal (3.15 ± 0.2 MHz) was slowly Theoretically, the number of created LANs can be estimated
modulated until the spherical aggregates alternately as 25 × 25 × L from Figure 2d. The L represented the layer
appeared and disappeared in the Z direction as the of LANs in the Z direction, which was equal to H/(λ/2),
microscope’s focus continued upward from the bottom when H (mm) was an integer multiple of half wavelength
(Videoclip S2, with description in Supplementary File). (λ = 500 μm in this acoustic device, so that L = 4H) [39-41] .
Subsequently, the GelMA solution was crosslinked by a Thus, the more layers of LANs were created, the greater
blue light (405 nm, 60 mW/cm , 30 s) to fix the assembled the total number of LANs. To verify it, we implemented
2
particle aggregates. To visualize the location of aggregates an experiment: Suitable volume of GelMA solutions was
within the GelMA hydrogel, a confocal microscopy repeatedly added into the acoustic chamber to form six H
was used. From the 3D confocal images (Figure 2c; values (3, 3.5, 4, 4.5, 5, 5.5 mm). Then, the vertical PZT was
Videoclip S3, with description in Supplementary File), exactly positioned at the level of the solution by a manual
the particle aggregates showed periodic distribution in Z-axis moving apparatus (minimum step, 10 μm). Once
both horizontal and vertical dimensions, forming a 3D particles were assembled by desired patterns, the GelMA
dot-array pattern, which is consistent with our simulation solution was photocrosslinked rapidly to form a GelMA
result. Besides, the aggregates can be counted from the hydrogel within 30 s of blue light exposure, for all the
bright image as 25 × 25 × 9 = 5625 (Figure 2d). liquids with the above-mentioned H values. To visualize
the Z-direction distribution of aggregates, the GelMA
3.3. High-throughput fabrication of aggregates hydrogel was placed side-down on a glass slide for the
To obtain more cell spheroids, more LANs needed to be observation of an inverted microscope. Figure 3a shows
created in the acoustic device. Given that the standing that the aggregates have a good array pattern, and the
BAWs present in the bulk of the solution, the number of numbers of the layered aggregates, by observation, are 12,
LANs could be increased by adding more solution into the 16, and 20, corresponding to H values of 3, 4, and 5 mm,
acoustic chamber; as a result, the height (H) of the solution respectively. Figure 3b shows that the layer of LANs was
Volume 9 Issue 4 (2023) 265 https://doi.org/10.18063/ijb.733