
Page 395 - IJB-9-4
P. 395
International Journal of Bioprinting Impingement shear stress during microvalve-based bioprinting
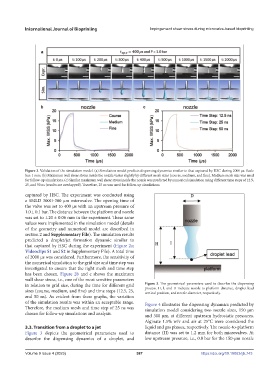
Figure 2. Validation of the simulation model. (a) Simulation model predicts dispensing dynamics similar to that captured by HSC during 2000 µs. Scale
bar: 1 mm. (b) Maximum wall shear stress inside the nozzle varies slightly by different mesh sizes (course, medium, and fine). Medium mesh size was used
for follow-up simulations. (c) Similar maximum wall shear stress inside the nozzle was predicted by numerical simulation using different time steps of 12.5,
25, and 50 ns (results are overlapped). Therefore, 25 ns was used for follow-up simulations.
captured by HSC. The experiment was conducted using
a SMLD 300G-300 µm microvalve. The opening time of
the valve was set to 400 µs with an upstream pressure of
1.0 ± 0.1 bar. The distance between the platform and nozzle
was set to 1.20 ± 0.06 mm in the experiment. These same
values were implemented in the simulation model (details
of the geometry and numerical model are described in
section 2 and Supplementary File). The simulation results
predicted a droplet/jet formation dynamic similar to
that captured by HSC during the experiment (Figure 2a;
Videoclips S1 and S2 in Supplementary File). A total time
of 2000 µs was considered. Furthermore, the sensitivity of
the numerical simulation to the grid size and time step was
investigated to ensure that the right mesh and time step
has been chosen. Figure 2b and c shows the maximum
wall shear stress, i.e., one of the most sensitive parameters
in relation to grid size, during the time for different grid Figure 3. The geometrical parameters used to describe the dispensing
sizes (course, medium, and fine) and time steps (12.5, 25, process. H, l, and D indicate nozzle-to-platform distance, droplet lead
vertical position, and nozzle diameter, respectively.
and 50 ns). As evident from these graphs, the variation
of the simulation results was within an acceptable range. Figure 4 illustrates the dispensing dynamics predicted by
Therefore, the medium mesh and time step of 25 ns was simulation model considering two nozzle sizes, 150 µm
chosen for follow-up simulations and analysis. and 300 µm, at different upstream hydrostatic pressures.
Alginate 1.5% w/v and air at 25°C were considered the
3.3. Transition from a droplet to a jet liquid and gas phases, respectively. The nozzle-to-platform
Figure 3 depicts the geometrical parameters used to distance (H) was set to 1.2 mm for both microvalves. At
describe the dispensing dynamics of a droplet, and low upstream pressure, i.e., 0.8 bar for the 150-µm nozzle
Volume 9 Issue 4 (2023) 387 https://doi.org/10.18063/ijb.743