
Page 398 - IJB-9-4
P. 398
International Journal of Bioprinting Impingement shear stress during microvalve-based bioprinting
Table 2. Ligament pinch-off time, Reynolds, Weber, and inside the alginate and between alginate and platform
Ohnesorge numbers at different upstream pressures for both until a stationary droplet stabilizes on the platform. The
nozzle sizes spatial distribution of impingement shear stress on the
D = 150 µm platform for the case of D = 300 µm and P = 1.0 bar is
P (Pa) Pinch-off Re max Re min We Oh max Oh min presented as a contour plot in Figure S1a (Supplementary
time (µs) File) at three selected time points of 460, 500, and 600 µs
0.8 No pinch-off 5.56 0.53 3.72 3.64 0.35 after opening of the nozzle. The contour plot shows that
the maximum of impingement shear stress occurs at the
1.2 920–930 8.56 0.81 8.80 3.64 0.35 proximity of the stagnation point at the beginning of
1.8 820–830 12.73 1.21 19.47 3.64 0.35 impingement. In Figure S1b (Supplementary File), the
2.4 790–800 16.66 1.59 33.34 3.64 0.35 dispensing dynamics captured by high-speed camera and
3.0 750–760 20.40 1.94 50.01 3.64 0.35 resulting from the simulation are plotted together with
D = 300 µm nozzle and impingement wall shear stress during 2000 µs.
P (Pa) Pinch-off Re max Re min We Oh max Oh min Figure 6c and d shows the maximum shear stress on the
time (µs) platform versus time for 150-µm and 300-µm nozzles,
0.3 No pinch-off 25.04 2.38 37.65 2.57 0.25 respectively. As is shown, for each of the upstream
pressures at first, the shear stress on the platform was
0.4 1700–1710 34.45 3.28 71.29 2.57 0.25 zero, which then increased suddenly to a maximum level
0.6 1660–1670 50.71 4.83 154.44 2.57 0.25 (when the droplet impinged on the platform), and then,
0.8 1660–1670 64.52 6.14 250.02 2.57 0.25 it decreased over time as the droplet was spreading on the
1.0 1710–1720 82.49 7.86 408.68 2.57 0.25 platform surface. The impingement shear stress increased
The pinch-off time represents the time when the ligament detached by pressure in a non-linear fashion. Surprisingly, the ratio
from the nozzle. The dimensionless parameters were calculated based between the maximum shear stress on the platform and
on the alginate average velocity at the outlet of nozzle at t = 400 μs.. The the maximum wall shear stress in the nozzle increased
zero shear viscosity of 0.315 Pa·s and infinite shear viscosity of 0.03 Pa·s by upstream pressure (Figure 6e and f). This indicates
and a surface tension of 0.05 N·m were used.
-1
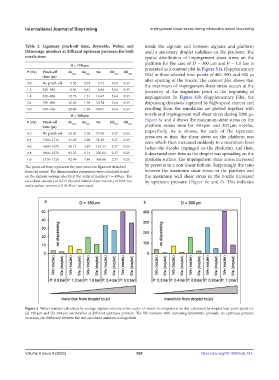
Figure 5. Weber number calculated by average alginate velocity at the outlet of nozzle in comparison to that calculated by droplet lead-point speed for
(a) 150-µm and (b) 300-µm microvalves at different upstream pressure. The We increases with increasing hydrostatic pressure. As upstream pressure
increases, the difference between the two calculated numbers is magnified.
Volume 9 Issue 4 (2023) 390 https://doi.org/10.18063/ijb.743