
Page 394 - IJB-9-4
P. 394
International Journal of Bioprinting Impingement shear stress during microvalve-based bioprinting
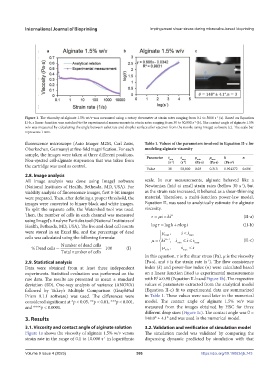
Figure 1. The viscosity of alginate 1.5% wt/v was measured using a rotary rheometer at strain rates ranging from 0.1 to 5000 s (a). Based on Equation
-1
II-b, a linear function was matched to the experimental measurements in strain rates ranging from 30 to 50,000 s (b). The contact angle of alginate 1.5%
-1
w/v was measured by calculating the angle between substrate and droplet surface after ejection from the nozzle using ImageJ software (c). The scale bar
represents 1 mm.
fluorescence microscope (Axio Imager M2M, Carl Zeiss, Table 1. Values of the parameters involved in Equation II-c for
Oberkochen, Germany) at five-fold magnification. For each modeling alginate viscosity
sample, the images were taken at three different positions. Parameter
Non-ejected cell-alginate suspension that was taken from s ˙ (s ) s ˙ (s ) μ (Pa·s) μ (Pa·s) k (Pa·s ) n
min
max
min
max
n
-1
-1
the cartridge was used as control.
Value 30 50,000 0.03 0.315 0.924272 0.686
2.8. Image analysis
All image analysis was done using ImageJ software scale. In our measurements, alginate behaved like a
-1
(National Institutes of Health, Bethesda, MD, USA). For Newtonian fluid at small strain rates (bellow 30 s ), but
viability analysis of fluorescence images, first 8-bit images as the strain rate increased, it behaved as a shear-thinning
were prepared. Then, after defining a proper threshold, the material. Therefore, a multi-function power-law model,
images were converted to binary black and white images. Equation II, was used to analytically estimate the alginate
To split the separate cells, the Watershed tool was used. viscosity.
Then, the number of cells in each channel was measured sks n (II-a)
using ImageJ’s Analyze Particles tool (National Institutes of
Health, Bethesda, MD, USA). The live and dead cell counts log log kn logs (II-b)
were stored in an Excel file, and the percentage of dead ,
ss
cells was calculated using the following formula: max min
s
ks n 1 , s s (II-c)
Number of dead cells min max
% Dead cells = 100 (I) min , max s s
Total number of cells
In this equation, τ is the shear stress (Pa), μ is the viscosity
-1
2.9. Statistical analysis (Pa·s), and s˙ is the strain rate (s ). The flow consistency
Data were obtained from at least three independent index (k) and power-law index (n) were calculated based
experiments. Statistical evaluation was performed on the on a linear function fitted to experimental measurements
2
raw data. The results are presented as mean ± standard with R ≅ 0.98 (Equation II-b and Figure 1b). The respective
deviation (SD). One-way analysis of variance (ANOVA) values of parameters extracted from the analytical model
followed by Tukey’s Multiple Comparison (GraphPad (Equation II-c) fit to experimental data are summarized
Prism 9.1.1 software) was used. The differences were in Table 1. These values were used later in the numerical
considered significant at *p < 0.05, **p < 0.01, ***p < 0.001, model. The contact angle of alginate 1.5% w/v was
and ****p < 0.0001. measured from the images obtained by HSC for three
different drop sizes (Figure 1c). The contact angle was θ =
3. Results 148.0° ± 4.1° and was used in the numerical model.
3.1. Viscosity and contact angle of alginate solution 3.2. Validation and verification of simulation model
Figure 1a shows the viscosity of alginate 1.5% w/v versus The simulation model was validated by comparing the
strain rate in the range of 0.1 to 10.000 s in logarithmic dispensing dynamic predicted by simulation with that
-1
Volume 9 Issue 4 (2023) 386 https://doi.org/10.18063/ijb.743