
Page 396 - IJB-9-4
P. 396
International Journal of Bioprinting Impingement shear stress during microvalve-based bioprinting
and 0.3 bar for the 300-µm nozzle, no droplet was formed Re and maximum Oh correspond to those calculated with
(first row in Figure 4a and b, respectively). As the upstream zero shear viscosity. By increasing the upstream pressure,
pressure was slightly increased, a single droplet was formed, Re and We increase, while the Oh remains constant and
pinched-off, and impinged on the platform (second and independent of upstream pressure.
third rows in Figure 4a and b). Increasing the upstream The speed of droplet lead point was calculated based on
pressure resulted in formation of a ligament following the second-order centered finite difference formula (Equation
main droplet that impinged on the platform (fourth row in IV). The results are depicted in Figure 4g and h for 150 and
Figure 4a and b). At relatively higher upstream pressure, 300 µm microvalves, respectively, for different upstream
a larger ligament formed a jet between the nozzle and pressures. In all cases, the speed of the lead point of the
platform that eventually pinched-off (fifth row in Figure 4a droplet was lower than the average alginate velocity at the
and b). The ligament pinch-off time was mainly affected by outlet of the nozzle. These differences became more evident
nozzle size but slightly also by upstream pressure (Table 2). for the larger nozzle and as the transition from droplet to
In the case of the 150-µm nozzle, the ligament pinched- jet occurred.
off between 750 and 930 µs, while for the 300-µm nozzle,
t
the ligament pinched-off between 1660 and 1720 µs. In the v t x t t x t O (IV)
2
lead
lead
t
case of the piezoelectric microvalve, a droplet pinch-off in droplet 2 t
less than 400 µs has been reported [14,15,27] . Another interesting observation was the fluctuation in
The average alginate velocity at the outlet of the nozzle droplet speed while traveling the distance between nozzle
is depicted versus time in Figure 4c and d for both nozzle and platform. This has also been reported during droplet
sizes. Obviously, the average velocity increases by time at ejection using piezoelectric microvalves for 1–2% w/v
the beginning and drops suddenly to zero at t = 400 µs, alginate solutions . The We calculated by the maximum
[15]
i.e., when the microvalve closes. While the flow inside the droplet lead-point speed was compared with the We
nozzle reached a steady state after about 150 µs for the calculated by average alginate velocity at the outlet of the
small nozzle size, it was transient throughout the entire nozzle and presented in Figures 4b and 5a for 150 and
opening time for the bigger nozzle. The one-dimensional 300 µm microvalves, respectively. In general, larger nozzle
solution of a quasi-steady laminar flow in a circular pipe size leads to a higher We number due to an increase in
is given by inertia with respect to surface tension. For the bigger nozzle,
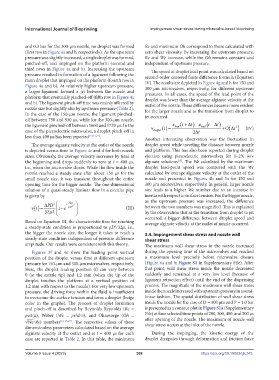
PD 2 32 2 t as the upstream pressure was increased, the difference
v t 1 e D (III) between the two numbers was magnified. This is explained
32 L by the observation that as the transition from droplet to jet
Based on Equation III, the characteristic time for reaching occurred, a bigger difference between droplet speed and
average alginate velocity at the outlet of nozzle occurred.
a steady-state condition is proportional to ρD ⁄ 32μ, i.e.,
2
the bigger the nozzle size, the longer it takes to reach a 3.4. Impingement shear stress and nozzle wall
steady-state condition independent of pressure difference shear stress
amplitude. Our results were consistent with this theory. The maximum wall shear stress in the nozzle increased
Figures 3f and 4e show the leading point vertical during the opening time of the microvalves and reached
position of the droplet versus time at different upstream a maximum level precisely before microvalve closure
pressure for 150-µm and 300-µm microvalves, respectively. (Figure 6a and b; Figure S1 in Supplementary File). After
Here, the droplet leading position (l) can vary between that point, wall shear stress inside the nozzle decreased
0 (at the nozzle tip) and 1.2 mm (when the tip of the suddenly and remained at a very low level (because of
droplet touches the platform at a vertical position of ligament retraction effect) until the end of the dispensing
1.2 mm with respect to the nozzle). For very low upstream process. The magnitude of the maximum wall shear stress
pressure, the driving force within the fluid is insufficient inside the nozzle increased with upstream pressure in a semi-
to overcome the surface tension and form a droplet (beige linear fashion. The spatial distribution of wall shear stress
color in the graphs). The process of droplet formation inside the nozzle for the case of D = 300 µm and P = 1.0 bar
and pinch-off is described by Reynolds Reynolds (Re = is presented as a contour plot in Figure S1a (Supplementary
ρvd ⁄ μ), Weber (We = ρv d ⁄ σ), and Ohnesorge (Oh = File) at four selected time points of 200, 300, 400, and 500 µs
2
√We ⁄ Re) numbers [12-15,27] . The respective values of these after opening of the nozzle. The maximum of nozzle wall
shear stress occurs at the inlet of the nozzle.
dimensionless parameters calculated based on the average
alginate velocity at the outlet and at t = 400 μs for each During the impinging, the kinetic energy of the
case are reported in Table 2. In this table, the minimum droplet dissipates through deformation and friction force
Volume 9 Issue 4 (2023) 388 https://doi.org/10.18063/ijb.743