
Page 413 - IJB-9-5
P. 413
International Journal of Bioprinting 3D-printed Mg scaffolds promote bone defect repair
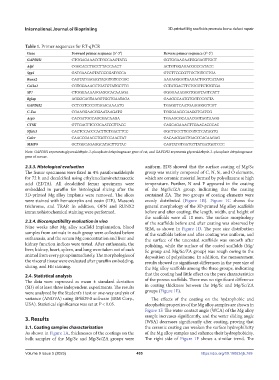
Table 1. Primer sequences for RT-qPCR
Gene Forward primer sequence (5’-3’) Reverse primer sequence (5’-3’)
GAPDH1 CTGGAGAAACCTGCCAAGTATG GGTGGAAGAATGGGAGTTGCT
Alpl CGGCACCTGCCTTACCAACT ACTGTGGAGACGCCCATACC
Spp1 GATGAACAGTATCCCGATGCCA GTCTTCCCGTTGCTGTCCTGA
Runx2 CAGTATGAGAGTAGGTGTCCCGC AAGAGGGGTAAGACTGGTCATAGG
Col1a1 CGTGGAAACCTGATGTATGCTTG CCTATGACTTCTGCGTCTGGTGA
SP7 CTGGGAAAAGGAGGCACAAAGA GGGGAAAGGGTGGGTAGTCATT
Bglap AGGGCAGTAAGGTGGTGAATAGA GAAGCCAATGTGGTCCGCTA
GAPDH2 CCTCGTCCCGTAGACAAAATG TGAGGTCAATGAAGGGGTCGT
C-Fos CGAAGGAACGGAATAAGATG TGGGAAGCCAAGGTCATCG
Acp5 CACGATGCCAGCGACAAGA TGAAGCGCAAACGGTAGTAAGG
CTSK GTTGACTTCCGCAATCCTTACC CAGCAGAAACTTGAACACCCAC
Nfatc1 CACTCCACCCACTTCTGACTTCC GGCTGCCTTCCGTCTCATAGTG
Calcr CAACCGAACCTGGTCCAACTAT GACAAGGAGTGACCCACAAGAG
MMP9 GCTGGCAGAGGCATACTTGTAC CAGTATGTGATGTTATGATGGTCCC
Note: GAPDH1 represents glyceraldehyde-3-phosphate dehydrogenase gene of rat, and GAPDH2 represents glyceraldehyde-3-phosphate dehydrogenase
gene of mouse.
2.3.3. Histological evaluation uniform. EDS showed that the surface coating of Mg/Sc
The femur specimens were fixed in 4% paraformaldehyde group was mainly composed of C, N, Si, and O elements,
for 72 h and decalcified using ethylenediaminetetraacetic which are ceramic material formed by polysilazane at high
acid (EDTA). All decalcified femur specimens were temperature. Further, N and P appeared in the coating
embedded in paraffin for histological slicing after the of the Mg/Sc/ZA group, indicating that the coating
3D-printed Mg alloy implants were removed. The slices contained ZA. The two groups of coating elements were
were stained with hematoxylin and eosin (HE), Masson’s evenly distributed (Figure 1B). Figure 1C shows the
trichrome, and TRAP. In addition, OPN and RUNX2 general morphology of the 3D-printed Mg alloy scaffolds
immunohistochemical staining were performed. before and after coating; the length, width, and height of
the scaffolds were all 10 mm. The surface morphology
2.3.4. Biocompatibility evaluation in vivo of the scaffolds before and after coating was observed by
Nine weeks after Mg alloy scaffold implantation, blood SEM, as shown in Figure 1D. The pore size distribution
samples from animals in each group were collected before of the scaffolds before and after coating was uniform, and
euthanasia, and the serum Mg concentration and liver and the surface of the uncoated scaffolds was smooth after
kidney function indices were tested. After euthanasia, the polishing, while the surface of the coated scaffolds (Mg/
liver, kidney, heart, spleen, and lung were taken out of each Sc group and Mg/Sc/ZA group) was rough owing to the
animal from every group immediately. The morphologies of deposition of polysilazane. In addition, the measurement
the visceral tissue were evaluated after paraffin embedding, results showed no significant differences in the pore size of
slicing, and HE staining. the Mg alloy scaffolds among the three groups, indicating
2.4. Statistical analysis that the coating had little effect on the pore characteristics
The data were expressed as mean ± standard deviation of the porous scaffolds. There was no significant difference
(SD) of at least three independent experiments. The results in coating thickness between the Mg/Sc and Mg/Sc/ZA
were analyzed by the Student’s t test or one-way analysis of groups (Figure 1E).
variance (ANOVA) using SPSS29.0 software (IBM Corp., The effects of the coating on the hydrophobic and
USA). Statistical significance was set at P < 0.05. oleophobic properties of the Mg alloy samples are shown in
Figure 1F. The water contact angle (WCA) of the Mg alloy
3. Results sample increases significantly, and the water sliding angle
(WSA) decreases significantly after coating, proving that
3.1. Coating samples characterization the ceramic coating can weaken the surface hydrophilicity
As shown in Figure 1A, thicknesses of the coatings on the of the Mg alloy samples and enhance their hydrophobicity.
bulk samples of the Mg/Sc and Mg/Sc/ZA groups were The right side of Figure 1F shows a similar trend. The
Volume 9 Issue 5 (2023) 405 https://doi.org/10.18063/ijb.769