
Page 357 - IJB-9-6
P. 357
International Journal of Bioprinting Surface modification of PCL scaffolds
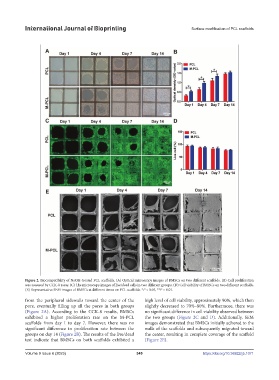
Figure 2. Biocompatibility of NaOH-treated PCL scaffolds. (A) Optical microscopy images of BMSCs on two different scaffolds. (B) Cell proliferation
was assessed by CCK-8 assay. (C) The microscopy images of live/dead cells in two different groups. (D) Cell viability of BMSCs on two different scaffolds.
(E) Representative SEM images of BMSCs at different times on PCL scaffolds. *P < 0.05, **P < 0.01.
from the peripheral sidewalls toward the center of the high level of cell viability, approximately 90%, which then
pore, eventually filling up all the pores in both groups slightly decreased to 70%–80%. Furthermore, there was
(Figure 2A). According to the CCK-8 results, BMSCs no significant difference in cell viability observed between
exhibited a higher proliferation rate on the M-PCL the two groups (Figure 2C and D). Additionally, SEM
scaffolds from day 1 to day 7. However, there was no images demonstrated that BMSCs initially adhered to the
significant difference in proliferation rate between the walls of the scaffolds and subsequently migrated toward
groups on day 14 (Figure 2B). The results of the live/dead the center, resulting in complete coverage of the scaffold
test indicate that BMSCs on both scaffolds exhibited a (Figure 2E).
Volume 9 Issue 6 (2023) 349 https://doi.org/10.36922/ijb.1071