
Page 276 - v11i4
P. 276
International Journal of Bioprinting 3D cell culture model for neural cell analysis
®
Figure 6. Qualitative analysis of the effect of CoCrMo (a), PEEK-OPTIMA™ (b), Ceridust 3615 (c), and ZTA (d) model particles embedded in
3D-bioprinted GelMA on the viability of C6 astrocyte-like and NG108-15 cells (Days 1, 3, and 5). Live cells were stained with green-fluorescent calcein
AM, cell nuclei with blue-fluorescent Hoechst, and dead cells with red-fluorescent propidium iodide. All scale bars = 300 μm. Abbreviations: CoCrMo:
Cobalt–chromium– molybdenum; GelMA: Gelatin methacryloyl; PEEK: Polyetheretherketone; ZTA: Zirconia-toughened alumina.
live/dead fluorescence staining, supported the quantitative production in C6 astrocyte-like cells (p = 0.003; Figure 7a).
results. Live C6 astrocyte-like and NG108-15 cells were Both the main effect of culture time (p < 0.01; Figure 7b)
identified by green fluorescence (calcein AM), nuclei and the type of biomaterial used in the 3D model particles
by blue fluorescence (Hoechst), and dead cells by red (p = 0.032; Figure 7c) were also statistically significant.
fluorescence (propidium iodide). Representative images Post hoc comparisons indicated that ROS production was
from Days 1, 3, and 5 revealed cell viability patterns markedly higher in cells exposed to CoCrMo particles
consistent with the luminescence-based measurements, compared to those exposed to PEEK-OPTIMA™ (p =
®
confirming the material-dependent and time-dependent 0.007), Ceridust 3615 (p = 0.025), and ZTA (p = 0.028). No
®
effects of CoCrMo, PEEK-OPTIMA™, Ceridust 3615, and significant differences in ROS levels were observed among
®
ZTA 3D model particles on both cell types. the PEEK-OPTIMA™, Ceridust 3615, and ZTA groups
(p = 0.946), suggesting a relatively comparable oxidative
3.3.2. Oxidative stress stress response among these materials.
The production of ROS by both C6 astrocyte-like and
NG108-15 cells was assessed across all 3D model particles. Statistical analysis of ROS production by NG108-15
Oxidative stress was measured on Days 3 and 5 using cells on Days 3 and 5 showed no significant interaction
a DCFDA probe, where ROS production was directly between culture duration and material type (p = 0.34;
proportional to the intensity of the green fluorescence. Figure 7d). Similarly, the main effect of culture time
The estimated marginal mean (±95% CI) of fluorescent on ROS levels was not statistically significant (p = 0.24;
intensity, reflecting ROS production in C6 astrocyte-like Figure 7e). However, the type of biomaterial used in the
and NG108-15 cells exposed to various model particles, is 3D model particles had a significant overall effect on ROS
production (p = 0.04; Figure 7f). Post hoc comparisons
presented in Figure 7.
revealed that NG108-15 cells exposed to PEEK-OPTIMA™
Statistical analysis revealed a significant interaction particles produced significantly lower ROS compared to
®
between culture duration and biomaterial type on ROS those exposed to CoCrMo (p = 0.018), Ceridust 3615
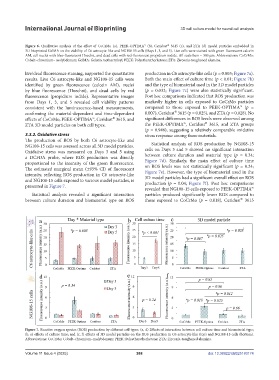
Figure 7. Reactive oxygen species (ROS) production by different cell types. (a, d) Effects of interaction between cell culture time and biomaterial type;
(b, e) effects of culture time; and (c, f) effects of 3D model particles on the ROS production in C6 astrocyte-like (top) and NG108-15 cells (bottom).
Abbreviations: CoCrMo: Cobalt–chromium–molybdenum; PEEK: Polyetheretherketone; ZTA: Zirconia-toughened alumina.
Volume 11 Issue 4 (2025) 268 doi: 10.36922/IJB025180174