
Page 184 - IJOCTA-15-1
P. 184
Y. Olmez et al. / IJOCTA, Vol.15, No.1, pp.166-182 (2025)
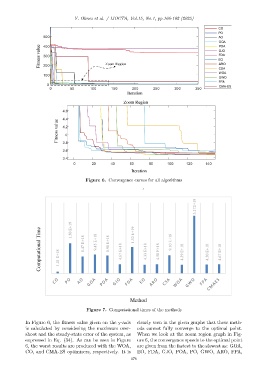
Figure 6. Convergence curves for all algorithms
Figure 7. Computational times of the methods
In Figure 6, the fitness value given on the y-axis clearly seen in the given graphs that these meth-
is calculated by considering the maximum over- ods cannot fully converge to the optimal point.
shoot and the steady-state error of the system, as When we look at the zoom region graph in Fig-
expressed in Eq. (34). As can be seen in Figure ure 6, the convergence speeds to the optimal point
6, the worst results are produced with the WOA, are given from the fastest to the slowest as: GOA,
CO, and CMA-ES optimizers, respectively. It is EO, FDA, GJO, POA, PO, GWO, ARO, FPA,
178