
Page 180 - IJOCTA-15-1
P. 180
Y. Olmez et al. / IJOCTA, Vol.15, No.1, pp.166-182 (2025)
Table 3. Parameter settings of the metaheuristic methods
Method Parameter and definition
PO n = 0.8, number of the political parties.
λ = 1.0, maximum limit of party switching rate.
AO α = 0.1, the constant value used in the exploitation phase.
δ = 0.1, the constant value used in the exploitation phase.
β = 1.5, the constant value related to the Levy function.
U = 0.265, a small value related to the narrowed exploration phase.
r 0 = 10
w = 0.005, a small value related to the narrowed exploration phase.
φ(0) = 3 ∗ pi/2.
S = 0.01, the constant value related to the Levy function.
GOA PSRs = 0.34, the success rate of the predator
S = 0.88, maximum speed of the gazelle.
M = {−1, 1}, direction of the gazelle
POA -
GJO C 1 = 1.5, constant value in Energy function.
β = 1.5, the constant value related to the Levy function
FDA β = 1, number of the neighbors.
EO a 1 = 2, the constant value used for exploration ability.
a 2 = 1, the constant value used for the exploitation ability.
GP = 0.5, generation probability
ARO -
CSA pa = 0.25, the discovery rate of alien eggs/solutions.
β = 3/2, levy parameter
WOA b = 1; spiral coefficient
GWO -
FPA P = 0.8, probability switch.
β = 3/2, levy parameter
CMA-ES alpha mu = 2, covariance update parameter
Table 4. Common control parameters of the metaheuristics
Parameter Definition Value
D Problem dimension 4
Max it Maximum number of iteration 500
N Number of the search agents 20
lb Lower limit 1
ub Upper limit 800
run Number of runs 5
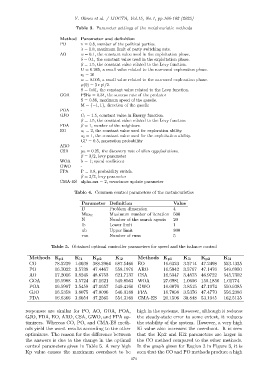
Table 5. Obtained optimal controller parameters for speed and the balance control
Methods K p1 K i1 K p2 K i2 Methods K p1 K i1 K p2 K i2
CO 78.5239 1.0038 388.3964 687.5466 EO 16.6323 3.5714 47.2498 553.1335
PO 16.7022 3.5738 47.4467 558.1976 ARO 16.5942 3.5767 47.1476 549.6950
AO 17.2016 3.8245 48.6753 621.7137 CSA 16.5347 3.4873 46.9722 545.7302
GOA 16.5988 3.5724 47.1621 549.8563 WOA 27.6981 1.0696 159.1850 1.01774
POA 16.5997 3.5458 47.1657 549.4160 GWO 16.6076 3.8515 47.1974 550.9385
GJO 16.5358 3.8075 47.0096 546.0188 FPA 16.7098 3.5376 47.4770 556.2386
FDA 16.6366 3.6054 47.2565 554.3169 CMA-ES 20.1506 30.848 53.1945 162.5135
responses are similar for PO, AO, GOA, POA, high in the systems. However, although it reduces
GJO, FDA, EO, ARO, CSA, GWO, and FPA op- the steady-state error to some extent, it reduces
timizers. Whereas CO, PO, and CMA-ES meth- the stability of the system. However, a very high
ods yield the worst results according to the other Ki value also increases the overshoot. It is seen
optimizers. The reason for the difference between that the Kp2 and Ki2 parameters are larger in
the answers is due to the change in the optimal the CO method compared to the other methods.
control parameters given in Table 5. A very high In the graph given for Region 2 in Figure 3, it is
Kp value causes the maximum overshoot to be seen that the CO and PO methods produce a high
174