
Page 210 - IJOCTA-15-4
P. 210
H. Kravitz et al. / IJOCTA, Vol.15, No.4, pp.750-778 (2025)
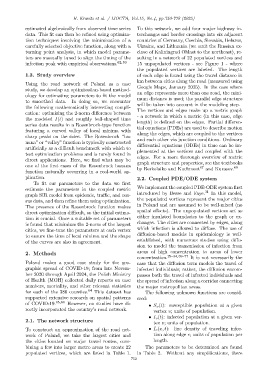
estimated algebraically from observed time series To this network, we add four major highway in-
data. This fit can then be refined using optimiza- terchanges and border crossings into six adjacent
tion techniques involving the minimization of a countries of Germany, Czechia, Slovakia, Belarus,
carefully selected objective function, along with a Ukraine, and Lithuania (we omit the Russian ex-
turning point analysis, in which model parame- clave of Kaliningrad Oblast to the northeast), re-
ters are manually tuned to align the timing of the sulting in a network of 22 populated vertices and
infection peak with empirical observations. 62,63 15 unpopulated vertices - see Figure 1 - where
the populated vertices are labeled. The length
1.3. Study overview of each edge is found using the travel distance in
km between cities along the road (measured using
Using the road network of Poland as a case
Google Maps, January 2025). In the case where
study, we develop an optimization-based method-
an edge represents more than one road, the mini-
ology for estimating parameters to fit the model
mum distance is used; the parallel edge structure
to smoothed data. In doing so, we encounter
the following mathematically interesting compli- will be taken into account in the modeling step.
cation: optimizing the 2-norm difference between The vertices and edges make up a metric graph
the modeled I(t) and roughly bell-shaped time - a network in which a metric (in this case, edge
series data results in a Rosenbrock-type function length) is defined on the edges. Partial differen-
featuring a curved valley of local minima with tial equations (PDEs) are used to describe motion
sharp peaks on the sides. The Rosenbrock “ba- along the edges, which are coupled to the vertices
and each other via junction conditions. Ordinary
nana” or “valley” function is typically constructed
differential equations (ODEs) in time can be im-
artificially as a difficult benchmark with which to
plemented at the vertices and coupled with the
test optimization problems and is rarely found in
edges. For a more thorough overview of metric
direct applications. Here, we find what may be
graph structure and properties, see the textbooks
one of the first cases of the Rosenbrock banana 67 68
by Berkolaiko and Kuchment and Kurasov.
function naturally occurring in a real-world ap-
plication. 2.2. Coupled PDE/ODE system
To fit our parameters to the data we first
We implement the coupled PDE-ODE system first
estimate the parameters in the coupled metric
introduced by Besse and Faye. 31 In this model,
graph SIR model from epidemic, traffic, and cen-
the populated vertices represent the major cities
sus data, and then refine them using optimization.
in Poland and are assumed to be well-mixed (no
The presence of the Rosenbrock function makes
spatial effects). The unpopulated vertices act as
direct optimization difficult, so the initial estima-
either insulated boundaries to the graph or ex-
tion is crucial. Once a suitable set of parameters
changes. The cities are connected by edges, along
is found that minimizes the 2-norm of the largest
which infection is allowed to diffuse. The use of
cities, we fine-tune the parameters at each vertex
diffusion-based models in epidemiology is well-
to ensure the time of local minima and the shape
established, with numerous studies using diffu-
of the curves are also in agreement.
sion to model the transmission of infection from
2. Methods areas of high concentration to areas of lower
concentration. 29–34,69–77 It is not necessarily the
Poland makes a good case study for the geo- case that the diffusion term models the travel of
graphic spread of COVID-19; from late Novem- infected individuals; rather, the diffusion encom-
ber 2020 through April 2024, the Polish Ministry passes both the travel of infected individuals and
of Health (MOH) collected daily reports on case the spread of infection along a corridor connecting
numbers, mortality, and other relevant statistics the major metropolitan areas.
for each of the 380 counties. 64 This dataset has The following unknown functions are consid-
supported extensive research on spatial patterns ered:
of COVID-19. 65,66 However, no studies have di- • S v (t): susceptible population at a given
rectly incorporated the country’s road network. vertex v; units of population.
• I v (t): infected population at a given ver-
2.1. The network structure
tex v; units of population.
To construct an approximation of the road net- • I e (x, t): line density of traveling infec-
work of Poland, we take the largest cities and tion along edge e; units of population per
the cities located on major travel routes, com- length.
bining a few into larger metro areas to create 22 The parameters to be determined are found
populated vertices, which are listed in Table 1. in Table 2. Without any simplifications, there
752