
Page 215 - IJOCTA-15-4
P. 215
Data-driven optimization and parameter estimation for an epidemic model
valley rather than converge directly toward the S(0) = 1 to reduce the parameters we need to
minimum, typically resulting in slow, zigzagging fit. The objective function plotted in the figure
convergence. To mitigate these difficulties, tech- is for an epidemic with an initial infected popu-
niques such as step-size limitation in line search lation of I(0) = 1E − 5 = 0.001% of the pop-
methods, 91 conjugate gradient algorithms that al- ulation, fit to a Gaussian f(x) = e − (x−b) 2 with
2σ 2
ternate descent directions, 90 and preconditioned σ = 10 and b = 35. The most interesting behav-
quasi-Newton methods 92,93 are commonly em-
ior in terms of Rosenbrock features occurs when
ployed. An alternative approach chosen in this
η is much smaller than β, which is characteristic
article is to use stochastic global optimization al- of a very long infectious period. Note the line of
gorithms, such as Genetic Algorithms (GA) 94–96 maxima (the worst Gaussian fit) where β = 100η
and Simulated Annealing (SA), 86,87,97,98 which
and the minima curve. A minimum of this func-
are more effective at escaping local minima and
tion exists at (β, η) ≈ (0.49, 8E − 4), but like the
exploring complex, multimodal landscapes. Be- classic Rosenbrock function, it is difficult to find
tween these two, we select simulated annealing
using standard optimization techniques due to the
due to its theoretical guarantee of global conver-
sloping valley with steep sides.
gence, provided the cooling schedule is sufficiently
slow. 97
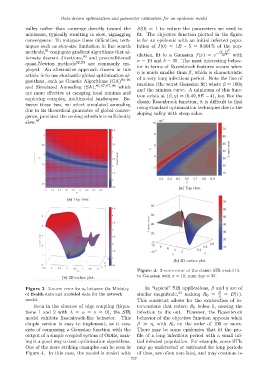
Figure 4. 2-norm error of the classic SIR model fit
to Gaussian with σ = 10, max day = 35.
Figure 3. 2-norm error for v 8 between the Ministry In “typical” SIR applications, β and η are of
of Health data and modeled data for the network similar magnitude, 24 making R 0 = β η = O(1).
model. This construct allows for the exploration of in-
Even in the absence of edge coupling (Equa- terventions that reduce R 0 below 1, causing the
tions 1 and 2 with λ = α = v = 0), the SIR infection to die out. However, the Rosenbrock
model exhibits Rosenbrock-like behavior. This behavior of the objective function appears when
simple version is easy to implement, as it con- β ≫ η, with R 0 on the order of 100 or more.
sists of comparing a Gaussian function with the There may be some epidemics that fit the pro-
output of a simple coupled system of ODEs, mak- file of a long infectious period with a small ini-
ing it a good way to test optimization algorithms. tial infected population. For example, some STIs
One of the more striking examples can be seen in may go undetected or untreated for long periods
Figure 4. In this case, the model is scaled with of time, are often non-fatal, and may continue to
757