
Page 217 - IJOCTA-15-4
P. 217
Data-driven optimization and parameter estimation for an epidemic model
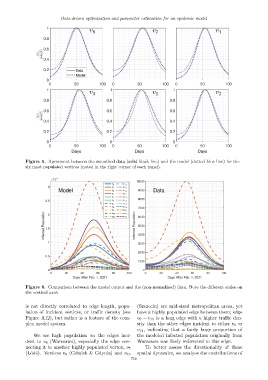
Figure 5. Agreement between the smoothed data (solid black line) and the model (dotted blue line) for the
six most populated vertices (noted in the right corner of each panel).
Figure 6. Comparison between the model output and the (non-normalized) data. Note the different scales on
the vertical axes.
is not directly correlated to edge length, popu- (Szczecin) are mid-sized metropolitan areas, yet
lation of incident vertices, or traffic density (see have a highly populated edge between them; edge
Figure A12), but rather is a feature of the com- v 9 − v 13 is a long edge with a higher traffic den-
plex model system. sity than the other edges incident to either v 9 or
v 13 , indicating that a fairly large proportion of
We see high population on the edges inci- the modeled infected population originally from
dent to v 8 (Warszawa), especially the edge con- Warszawa was likely redirected to this edge.
necting it to another highly populated vertex, v 7 To better assess the directionality of these
( L´od´z). Vertices v 9 (Gda´nsk & Gdynia) and v 13 spatial dynamics, we analyze the contributions of
759