
Page 218 - IJOCTA-15-4
P. 218
H. Kravitz et al. / IJOCTA, Vol.15, No.4, pp.750-778 (2025)
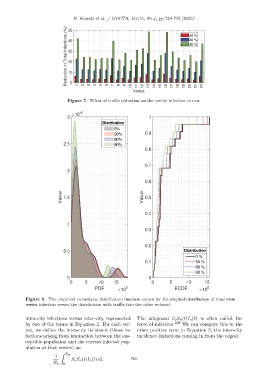
Figure 7. Effect of traffic reduction on the vertex infection curves.
Figure 8. The empirical cumulative distribution function curves for the original distribution of maximum
vertex infection versus the distribution with traffic into the cities reduced.
intra-city infections versus inter-city, represented The integrand β v S v (t)I v (t) is often called the
by two of the terms in Equation 2. For each ver- force of infection. 108 We can compare this to the
tex, we define the intra-city incidence (those in- other positive term in Equation 2, the inter-city
fections arising from interaction between the sus- incidence (infections coming in from the edges).
ceptible population and the current infected pop-
ulation at that vertex) as:
Z
1 T F
β v S v (t)I v (t) dt. 760
N v 0