
Page 219 - IJOCTA-15-4
P. 219
Data-driven optimization and parameter estimation for an epidemic model
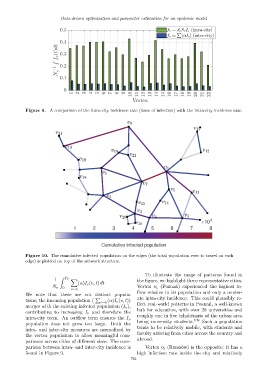
Figure 9. A comparison of the intra-city incidence rate (force of infection) with the intra-city incidence rate.
Figure 10. The cumulative infected population on the edges (the total population ever to travel on each
edge) is plotted on top of the network structure.
To illustrate the range of patterns found in
1 Z T F X the figure, we highlight three representative cities.
(α)I e (v, t) dt
N v 0 e∼v Vertex v 1 (Pozna´n) experienced the highest in-
We note that these are not distinct popula- flow relative to its population and only a moder-
P ate intra-city incidence. This could plausibly re-
tions; the incoming population ( e∼v (α)I e (v, t))
merges with the existing infected population (I v ), flect real-world patterns in Pozna´n, a well-known
contributing to increasing I v and therefore the hub for education, with over 20 universities and
roughly one in five inhabitants of the urban area
intra-city term. An outflow term ensures the I v 109
being university students. Such a population
population does not grow too large. Both the
tends to be relatively mobile, with students and
intra- and inter-city measures are normalized by
faculty arriving from cities across the country and
the vertex population to allow meaningful com-
abroad.
parisons across cities of different sizes. The com-
parison between intra- and inter-city incidence is Vertex v 5 (Rzesz´ow) is the opposite: it has a
found in Figure 9. high infection rate inside the city and relatively
761