
Page 108 - IJPS-1-1
P. 108
Finding a job in urban China: A comparative analysis of migrants and natives
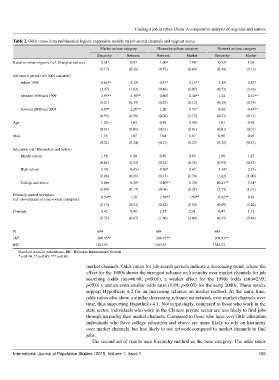
Table 2. Odds ratios from multinomial logistic regression models on job search channels and migrant status
Market as base category Hierarchy as base category Network as base category
Hierarchy Network Network Market Hierarchy Market
Rural-to-urban migrants (ref: Shanghai natives) 0.51* 0.97 1.90* 1.96* 0.53* 1.03
(0.17) (0.29) (0.52) (0.64) (0.14) (0.31)
Job search period (ref: 2005 and after)
before 1990 6.68** 3.15* 0.47* 0.15** 2.12* 0.32*
(3.27) (1.62) (0.16) (0.07) (0.72) (0.16)
between 1990 and 1999 2.95** 2.38** 0.807 0.34** 1.24 0.42**
(1.01) (0.79) (0.23) (0.12) (0.35) (0.14)
between 2000 and 2004 1.89* 2.26** 1.20 0.53* 0.84 0.44**
(0.53) (0.58) (0.30) (0.15) (0.21) (0.11)
Age 1.02+ 1.02 0.99 0.98+ 1.01 0.98
(0.01) (0.01) (0.01) (0.01) (0.01) (0.01)
Male 1.03 1.07 1.04 0.97 0.96 0.93
(0.24) (0.24) (0.21) (0.23) (0.20) (0.21)
Education (ref: Elementary and below)
Middle school 1.58 0.80 0.50 0.63 1.98 1.25
(0.88) (0.33) (0.24) (0.35) (0.93) (0.52)
High school 1.50 0.45+ 0.30* 0.67 3.34* 2.23+
(0.86) (0.20) (0.15) (0.38) (1.62) (1.00)
College and above 3.06+ 0.30* 0.10** 0.33+ 10.21** 3.34*
(1.99) (0.17) (0.06) (0.21) (5.75) (1.91)
Privately-owned workplace 0.50** 1.20 2.39** 1.99** 0.42** 0.83
(ref: Government or state-owned enterprise)
(0.13) (0.31) (0.52) (0.50) (0.09) (0.22)
Constant 0.42 0.90 2.15 2.41 0.47 1.12
(0.35) (0.67) (1.60) (2.04) (0.35) (0.84)
N 684 684 684
2
chi 208.93** 208.93** 208.93**
BIC 1383.53 1383.53 1383.53
Standard errors in parentheses. BIC: Bayesian Information Criterion
* p<0.10, ** p<0.05, *** p<0.01.
market channels. Odds ratios for job search periods indicate a decreasing trend, where the
effect for the 1980s shows the strongest reliance on hierarchy over market channels for job
searching (odds ratio=6.68; p<0.01), a weaker effect for the 1990s (odds ratio=2.95;
p<0.01), and an even smaller odds ratio (1.89; p<0.05) for the early 2000s. These results
support Hypothesis 4.2 for an increasing reliance on market method. At the same time,
odds ratios also show a similar decreasing reliance on network over market channels over
time, thus supporting Hypothesis 4.1. Not surprisingly, compared to those who work in the
state sector, individuals who work in the Chinese private sector are less likely to find jobs
through hierarchy than market channels. Compared to those who have very little education,
individuals who have college education and above are more likely to rely on hierarchy
over market channels, but less likely to use network compared to market channels to find
jobs.
The second set of results uses hierarchy method as the base category. The odds ratios
International Journal of Population Studies | 2015, Volume 1, Issue 1 102