
Page 29 - IJPS-1-1
P. 29
Yasuhiko Saito, Shieva Davarian, Atsuhiko Takahashi, Edward Schneider and Eileen M. Crimmins
Table 2. Hypertensive states: healthy, undiagnosed, controlled, uncontrolled by country
Japan United States
Percent Percent
Healthy 17.8 (16.1–19.3) 24.0 (22.6–25.4)
Undiagnosed 44.3 (42.2–46.4) 11.9 (10.8–12.9)
Controlled 8.0 (6.8–9.1) 36.5 (34.9–38.1)
Uncontrolled 29.9 (28.1–31.9) 27.6 (26.1–29.5)
Total 100.0 100.0
n 2309 3517
Japanese also experience much lower levels of controlled hypertension (8.0%) compared
to the U.S. (36.5%). However, uncontrolled blood pressure is not significantly different in
the U.S. (27.6%) and Japan (29.9%). The proportion healthy (without any hypertension) is
somewhat higher in the U.S. (24.0% vs 17.8%).
3.2 Blood Pressure Values in the U.S. and Japan
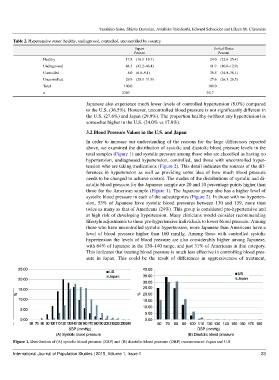
In order to increase our understanding of the reasons for the large differences reported
above, we examined the distribution of systolic and diastolic blood pressure levels in the
total samples (Figure 1) and systolic pressure among those who are classified as having no
hypertension, undiagnosed hypertension, controlled, and those with uncontrolled hyper-
tension who are taking medications (Figure 2). This detail indicates the sources of the dif-
ferences in hypertension as well as providing some idea of how much blood pressure
needs to be changed to achieve control. The modes of the distributions of systolic and di-
astolic blood pressure for the Japanese sample are 20 and 10 percentage points higher than
those for the American sample (Figure 1). The Japanese group also has a higher level of
systolic blood pressure in each of the subcategories (Figure 2). In those with no hyperten-
sion, 53% of Japanese have systolic blood pressures between 130 and 139, more than
twice as many as that of Americans (24%). This group is considered pre-hypertensive and
at high risk of developing hypertension. Many clinicians would consider recommending
lifestyle adjustments to these pre-hypertensive individuals to lower blood pressure. Among
those who have uncontrolled systolic hypertension, more Japanese than Americans have a
level of blood pressure higher than 160 mmHg. Among those with controlled systolic
hypertension the levels of blood pressure are also considerably higher among Japanese,
with 64% of Japanese in the 130–140 range, and just 31% of Americans in that category.
This indicates that treating blood pressure is much less effective in controlling blood pres-
sure in Japan. This could be the result of differences in aggressiveness of treatment,
Figure 1. Distribution of (A) systolic blood pressure (SBP) and (B) diastolic blood pressure (DBP) measurement: Japan and U.S.
International Journal of Population Studies | 2015, Volume 1, Issue 1 23