Page 40 - IJPS-1-1
P. 40

Concordance and discordance in successful aging measures and mortality

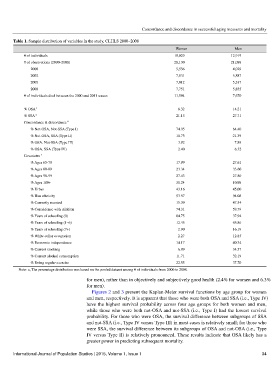
       Table 1. Sample distribution of variables in the study, CLHLS 2000–2008
                                                                            Women                    Men
           # of individuals                                                18,029                    12,919
           # of observations (2000–2008)                                   28,130                  21,088
              2000                                                          5,536                   4,029
              2002                                                          7,831                   5,887
              2005                                                          7,012                   5,337
              2008                                                          7,751                   5,835
           # of individuals died between the 2000 and 2011 waves           11,594                   7,670

           % OSA  a                                                          6.32                   14.21
           % SSA  a                                                         21.13                   27.71
           Concordance & discordance  a
              % Not-OSA, Not-SSA (Type I)                                   74.95                   64.40
              % Not-OSA, SSA (Type II)                                      18.73                   21.39
              % OSA, Not-SSA (Type III)                                      3.92                    7.89
              % OSA, SSA (Type IV)                                           2.40                    6.32
           Covariates  a
              % Ages 65-79                                                  17.99                   27.61
              % Ages 80-89                                                  23.34                   33.60
              % Ages 90-99                                                  27.43                   27.80
              % Ages 100+                                                   31.24                   10.98
              % Urban                                                       43.16                   45.00
              % Han ethnicity                                               93.57                   94.08
              % Currently married                                           15.39                   47.54
              % Coresidence with children                                   74.31                   59.79
              % Years of schooling (0)                                      84.75                   37.94
              % Years of schooling (1–6)                                    12.45                   45.86
              % Years of schooling (7+)                                      2.90                   16.19
              % White collar occupation                                      2.27                   12.85
              % Economic independence                                       14.17                   40.34
              % Current smoking                                              6.89                   34.57
              % Current alcohol consumption                                 11.71                   32.19
              % Doing regular exercise                                      22.55                   37.70
         Note: a, The percentage distribution was based on the pooled dataset among # of individuals from 2000 to 2008.

                                      for men), rather than in objectively and subjectively good health (2.4% for women and 6.3%
                                      for men).
                                        Figures 2 and 3 present the Kaplan-Meier survival functions by age group for women
                                      and men, respectively. It is apparent that those who were both OSA and SSA (i.e., Type IV)
                                      have the highest survival  probability across four age  groups for both women  and men,
                                      while those who were both not-OSA and not-SSA (i.e., Type I) had the lowest survival
                                      probability. For those who were OSA, the survival difference between subgroups of SSA
                                      and not-SSA (i.e., Type IV versus Type III) in most cases is relatively small; for those who
                                      were SSA, the survival difference between its subgroups of OSA and not-OSA (i.e., Type
                                      IV versus Type II) is relatively pronounced. These results indicate that OSA likely has a
                                      greater power in predicting subsequent mortality.

       International Journal of Population Studies | 2015, Volume 1, Issue 1                                    34
   35   36   37   38   39   40   41   42   43   44   45