
Page 41 - IJPS-1-1
P. 41
Danan Gu
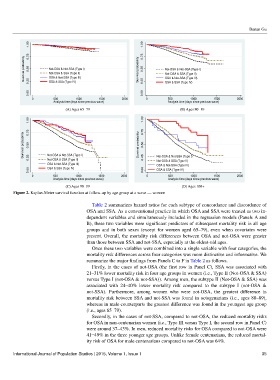
1.00 0.75 1.00 0.75
Survival probability 0.50 0.25 Not-OSA & Not-SSA (Type I) Survival probability 0.50 0.25 Not-OSA & Not-SSA (Type I)
Not-OSA & SSA (Type II)
Not-OSA & SSA (Type II)
OSA & Not-SSA (Type III)
OSA & Not-SSA (Type III)
0.00 OSA & SSA (Type IV) 0.00 OSA & SSA (Type IV)
0 500 1000 1500 2000 0 500 1000 1500 2000
Analysis time (days since previous wave) Analysis time (days since previous wave)
(A) Ages 65−79 (B) Ages 80−89
1.00 1.00 0.75
Survival probability 0.75 0.50 Survival probability 0.50
Not-OSA & Not-SSA (Type I)
0.25
Not-OSA & SSA (Type II)
Not-OSA & SSA (Type II)
OSA & Not-SSA (Type III) 0.25 Not-OSA & Not-SSA (Type I)
OSA & Not-SSA (Type III)
0.00 OSA & SSA (Type IV) 0.00 OSA & SSA (Type IV)
0 500 1000 1500 2000 0 500 1000 1500 2000
Analysis time (days since previous wave) Analysis time (days since previous wave)
(C) Ages 90−99 (D) Ages 100+
Figure 2. Kaplan-Meier survival function at follow-up by age group at a wave — women
Table 2 summarizes hazard ratios for each subtype of concordance and discordance of
OSA and SSA. As a conventional practice in which OSA and SSA were treated as two in-
dependent variables and simultaneously included in the regression models (Panels A and
B), these two variables were significant predictors of subsequent mortality risk in all age
groups and in both sexes (except for women aged 65–79), even when covariates were
present. Overall, the mortality risk differences between OSA and not-OSA were greater
than those between SSA and not-SSA, especially at the oldest-old ages.
Once these two variables were combined into a single variable with four categories, the
mortality risk differences across four categories was more distinctive and informative. We
summarize the major findings from Panels C to F in Table 2 as follows.
Firstly, in the cases of not-OSA (the first row in Panel C), SSA was associated with
21–31% lower mortality risk in four age groups in women (i.e., Type II (Not-OSA & SSA)
versus Type I (not-OSA & not-SSA)). Among men, the subtype II (Not-OSA & SSA) was
associated with 24–40% lower mortality risk compared to the subtype I (not-OSA &
not-SSA). Furthermore, among women who were not-OSA, the greatest difference in
mortality risk between SSA and not-SSA was found in octogenarians (i.e., ages 80–89),
whereas in male counterparts the greatest difference was found in the youngest age group
(i.e., ages 65–79).
Secondly, in the cases of not-SSA, compared to not-OSA, the reduced mortality risks
for OSA in non-centenarian women (i.e., Type III versus Type I, the second row in Panel C)
were around 37–43%. In men, reduced mortality risks for OSA compared to not-OSA were
41−49% in the three younger age groups. Unlike female centenarians, the reduced mortal-
ity risk of OSA for male centenarians compared to not-OSA was 64%.
International Journal of Population Studies | 2015, Volume 1, Issue 1 35