
Page 42 - IJPS-1-1
P. 42
Concordance and discordance in successful aging measures and mortality
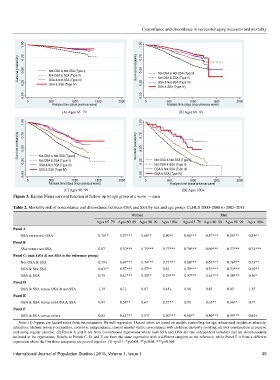
1.00 1.00
Survival probability 0.75 0.50 Not-OSA & Not-SSA (Type I) Survival probability 0.75 0.50 Not-OSA & Not-SSA (Type I)
Not-OSA & SSA (Type II)
OSA & Not-SSA (Type III)
0.25 OSA & Not-SSA (Type III) 0.25 Not-OSA & SSA (Type II)
OSA & SSA (Type IV)
OSA & SSA (Type IV)
0.00 0.00
0 500 1000 1500 2000 0 500 1000 1500 2000
Analysis time (since previous wave) Analysis time (days since previous wave)
(A) Ages 65−79 (B) Ages 80−89
1.00 1.00
Survival probability 0.75 0.50 Survival probability 0.75 0.50
Not-OSA & SSA (Type II)
0.25 Not-OSA & Not-SSA (Type I) 0.25 Not-OSA & Not-SSA (Type I)
Not-OSA & SSA (Type II)
OSA & Not-SSA (Type III)
OSA & SSA (Type IV) OSA & Not-SSA (Type III)
0.00 0.00 OSA & SSA (Type IV)
0 500 1000 1500 2000 0 500 1000 1500 2000
Analysis time (days since previous wave) Analysis time (since previous wave)
(C) Ages 90−99 (D) Ages 100+
Figure 3. Kaplan-Meier survival function at follow-up by age group at a wave — men
Table 2. Mortality risk of concordance and discordance between OSA and SSA by sex and age group, CLHLS 2000–2008 to 2002–2011
Women Men
Ages 65–79 Ages 80–89 Ages 90–99 Ages 100+ Ages 65–79 Ages 80–89 Ages 90–99 Ages 100+
Panel A
OSA versus not-OSA 0.71** 0.57*** 0.60** 0.50** 0.68*** 0.57*** 0.58*** 0.54**
Panel B
SSA versus not-SSA 0.87 0.70*** 0.75*** 0.77*** 0.70*** 0.69*** 0.77*** 0.74***
Panel C: (not-OSA & not-SSA is the reference group)
Not-OSA & SSA 0.79+ 0.69*** 0.74*** 0.77*** 0.60*** 0.67*** 0.76*** 0.73**
OSA & Not-SSA 0.63** 0.57*** 0.57** 0.63 0.59*** 0.53*** 0.53*** 0.36**
OSA & SSA 0.75 0.41*** 0.50** 0.29*** 0.57*** 0.44*** 0.50*** 0.56*
Panel D
OSA & SSA versus OSA & not-SSA 1.19 0.71 0.87 0.45+ 0.96 0.83 0.95 1.55
Panel E
OSA & SSA versus not-OSA & SSA 0.94 0.58** 0.67 0.37** 0.95 0.65** 0.66** 0.77
Panel F
OSA & SSA versus others 0.83 0.44*** 0.53* 0.30*** 0.68** 0.50*** 0.55*** 0.62+
Note: (1) Figures are hazard ratios from the parametric Weibull regression. Hazard ratios are based on models controlling for age, urban-rural residence, ethnicity,
education, lifetime primary occupation, economic independence, current marital status, co-residence with children, currently smoking, alcohol consumption at present,
and doing regular exercise. (2) Panels A and B are from conventional regressions where both SSA and OSA are two independent variables and are simultaneously
included in the regressions. Results in Panels C, D, and E are from the same regression with a different category as the reference, while Panel F is from a different
regression where the first three categories are pooled together. (3) +p<0.1, *p<0.05, **p<0.01, ***p<0.001.
International Journal of Population Studies | 2015, Volume 1, Issue 1 36