
Page 99 - IJPS-1-1
P. 99
Frank T. Denton and Byron G. Spencer
and territories,” CANSIM, Table 051-0001 (accessed September 30, 2014).
Storesletten K. (2000). Sustaining fiscal policy through immigration. Journal of Political Economy,
108(2), 300–323. http://dx.doi.org/10.1086/262120
United Nations (2013). World Population Aging 2013, New York: United Nations Department of Eco-
nomic and Social Affairs, Population Division.
Appendix: The Leslie Matrix
The Leslie matrix Q used in Equation (1) and subsequent equations is the 10×10 matrix
shown in Table A1. The first five rows are for female age groups, youngest to oldest; the
next five rows are for males. The entry in the Q(1,2) cell represents the calculation of fe-
male children, incorporating an adjustment for newborn mortality: F is the fertility rate
(applied to Young Adult females), r f is the proportion of females at birth, and s f0 is the sur-
vival rate for female births; the entry in the Q(6,2) cell, s m0r mF, represents the correspond-
ing calculation for male children. The group-to-group survival rates for females are pro-
vided in cells Q(2,1), Q(3,2), Q(4,3), Q(5,4); the corresponding rates for males are pro-
vided in cells Q(7,6), Q(8,7), Q(9,8), Q(10,9).
The Q matrix can be applied sequentially to project an initial population vector n 0 k
generations ahead, ignoring immigration and assuming all rates constant: n = Qn 0 ,n =
2
1
k
Qn 1 , ,n = Qn k 1 − or, more compactly, n k = Q n 0. (For discussion of Leslie matrices,
k
their characteristics and application, see Keyfitz and Caswell, 2005, Chapter 7.)
The survival rates in Q are calibrated using 2001 Canadian life tables. (The tables are
based on deaths in the years 2000, 2001, 2002 but are commonly referred to as 2001 tables
(Statistics Canada, 2006). F is initially set at 1.6 children per woman, the total fertility rate
in Canada in 2011 (Statistics Canada, 2013a). The ratio of males to females at birth is set
at 1.05, yielding 0.488 and 0.512 as the female and male proportions, approximately the
longstanding proportions in Canada. (The ratio 1.05 is within a normal range: “In the ab-
sence of manipulation, the sex ratio at birth is remarkably consistent across human popula-
tions, with 105 – 107 male births for every 100 female births,” Hesketh and Xing, 2006, p
13271.)
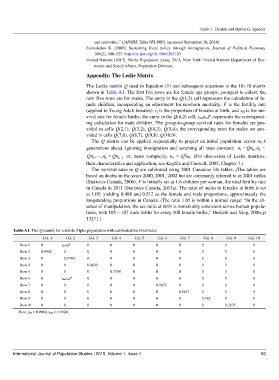
Table A1. The Q matrix for a stable Alpha population with calibrated survival rates
Col. 1 Col. 2 Col. 3 Col. 4 Col. 5 Col. 6 Col. 7 Col. 8 Col. 9 Col. 10
Row 1 0 s f 0r fF 0 0 0 0 0 0 0 0
Row 2 0.9942 0 0 0 0 0 0 0 0 0
Row 3 0 0.9769 0 0 0 0 0 0 0 0
Row 4 0 0 0.8635 0 0 0 0 0 0 0
Row 5 0 0 0 0.3798 0 0 0 0 0 0
Row 6 0 s m0r mF 0 0 0 0 0 0 0 0
Row 7 0 0 0 0 0 0.9875 0 0 0 0
Row 8 0 0 0 0 0 0 0.9617 0 0 0
Row 9 0 0 0 0 0 0 0 0.785 0 0
Row10 0 0 0 0 0 0 0 0 0.2575 0
Note: s f 0 = 0.9940, s m0 = 0.9924.
International Journal of Population Studies | 2015, Volume 1, Issue 1 93