
Page 95 - IJPS-1-1
P. 95
Frank T. Denton and Byron G. Spencer
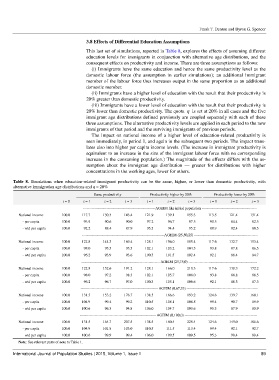
3.8 Effects of Differential Education Assumptions
This last set of simulations, reported in Table 8, explores the effects of assuming different
education levels for immigrants in conjunction with alternative age distributions, and the
consequent effects on productivity and income. There are three assumptions as follows:
(i) Immigrants have the same education and hence the same productivity level as the
domestic labour force (the assumption in earlier simulations); an additional immigrant
member of the labour force thus increases output in the same proportion as an additional
domestic member.
(ii) Immigrants have a higher level of education with the result that their productivity is
20% greater than domestic productivity.
(iii) Immigrants have a lower level of education with the result that their productivity is
20% lower than domestic productivity. The quota is set at 20% in all cases and the five
immigrant age distributions defined previously are coupled separately with each of these
three assumptions. The alternative productivity levels are applied in each period to the new
immigrants of that period and the surviving immigrants of previous periods.
The impact on national income of a higher level of education-related productivity is
seen immediately, in period 1, and again in the subsequent two periods. The impact trans-
lates also into higher per capita income levels. (The increase in immigrant productivity is
equivalent to an increase in the size of the immigrant labour force with no corresponding
increase in the consuming population.) The magnitude of the effects differs with the as-
sumption about the immigrant age distribution — greater for distributions with higher
concentrations in the working ages, lower for others.
Table 8. Simulations when education-related immigrant productivity can be the same, higher, or lower than domestic productivity, with
alternative immigration age distributions and q = 20%
Same productivity Productivity higher by 20% Productivity lower by 20%
t = 0 t = 1 t = 2 t = 3 t = 1 t = 2 t = 3 t = 1 t = 2 t = 3
----------------------------------------------------------AGEIM like initial population --------------------------------------------
National income 100.0 117.7 130.3 143.4 121.9 139.1 155.3 113.5 121.4 131.4
- per capita 100.0 93.9 90.6 90.0 97.2 96.7 97.5 90.5 84.4 82.5
- wtd per capita 100.0 92.2 88.4 87.9 95.5 94.4 95.2 88.9 82.4 80.5
------------------------------------------------------------------AGEIM (25,50,25) ---------------------------------------------------
National income 100.0 122.8 144.3 169.4 128.1 156.0 185.4 117.6 132.7 153.4
- per capita 100.0 98.0 95.5 95.5 102.1 103.2 104.5 93.8 87.8 86.5
- wtd per capita 100.0 96.2 93.9 93.6 100.3 101.5 102.4 92.1 86.4 84.7
--------------------------------------------------------------- AGEIM (25,75,0) -------------------------------------------------------
National income 100.0 122.8 152.6 191.2 128.1 166.0 210.3 117.6 139.3 172.2
- per capita 100.0 98.0 97.2 98.3 102.1 105.7 108.0 93.8 88.8 88.5
- wtd per capita 100.0 96.2 96.7 97.0 100.3 105.1 106.6 92.1 88.3 87.3
-------------------------------------------------------------- AGEIM (0,67,33) ---------------------------------------------------------
National income 100.0 131.5 153.2 176.7 138.5 166.6 193.2 124.6 139.7 160.1
- per capita 100.0 104.9 99.4 99.2 110.5 108.1 108.5 99.4 90.7 89.9
- wtd per capita 100.0 100.6 96.3 94.8 106.0 104.7 103.6 95.3 87.9 85.9
------------------------------------------------------------- AGEIM (0,100,0) ----------------------------------------------------------
National income 100.0 131.5 164.7 207.5 138.5 180.4 228.4 124.6 149.0 186.6
- per capita 100.0 104.9 101.8 103.0 110.5 111.5 113.4 99.4 92.1 92.7
- wtd per capita 100.0 100.6 99.9 99.4 106.0 109.5 109.5 95.3 90.4 89.4
Note: See relevant parts of note to Table 1.
International Journal of Population Studies | 2015, Volume 1, Issue 1 89